Customer Reports
There are a number of different reports in Metorik for looking at customer data.
One thing to note is that Metorik treats guests and customers the same. As such, guests will be included in all customer-related reports. You can read more about this here: What is the difference between customers and guests in WooCommerce and Metorik?
In this article
The Customer Report
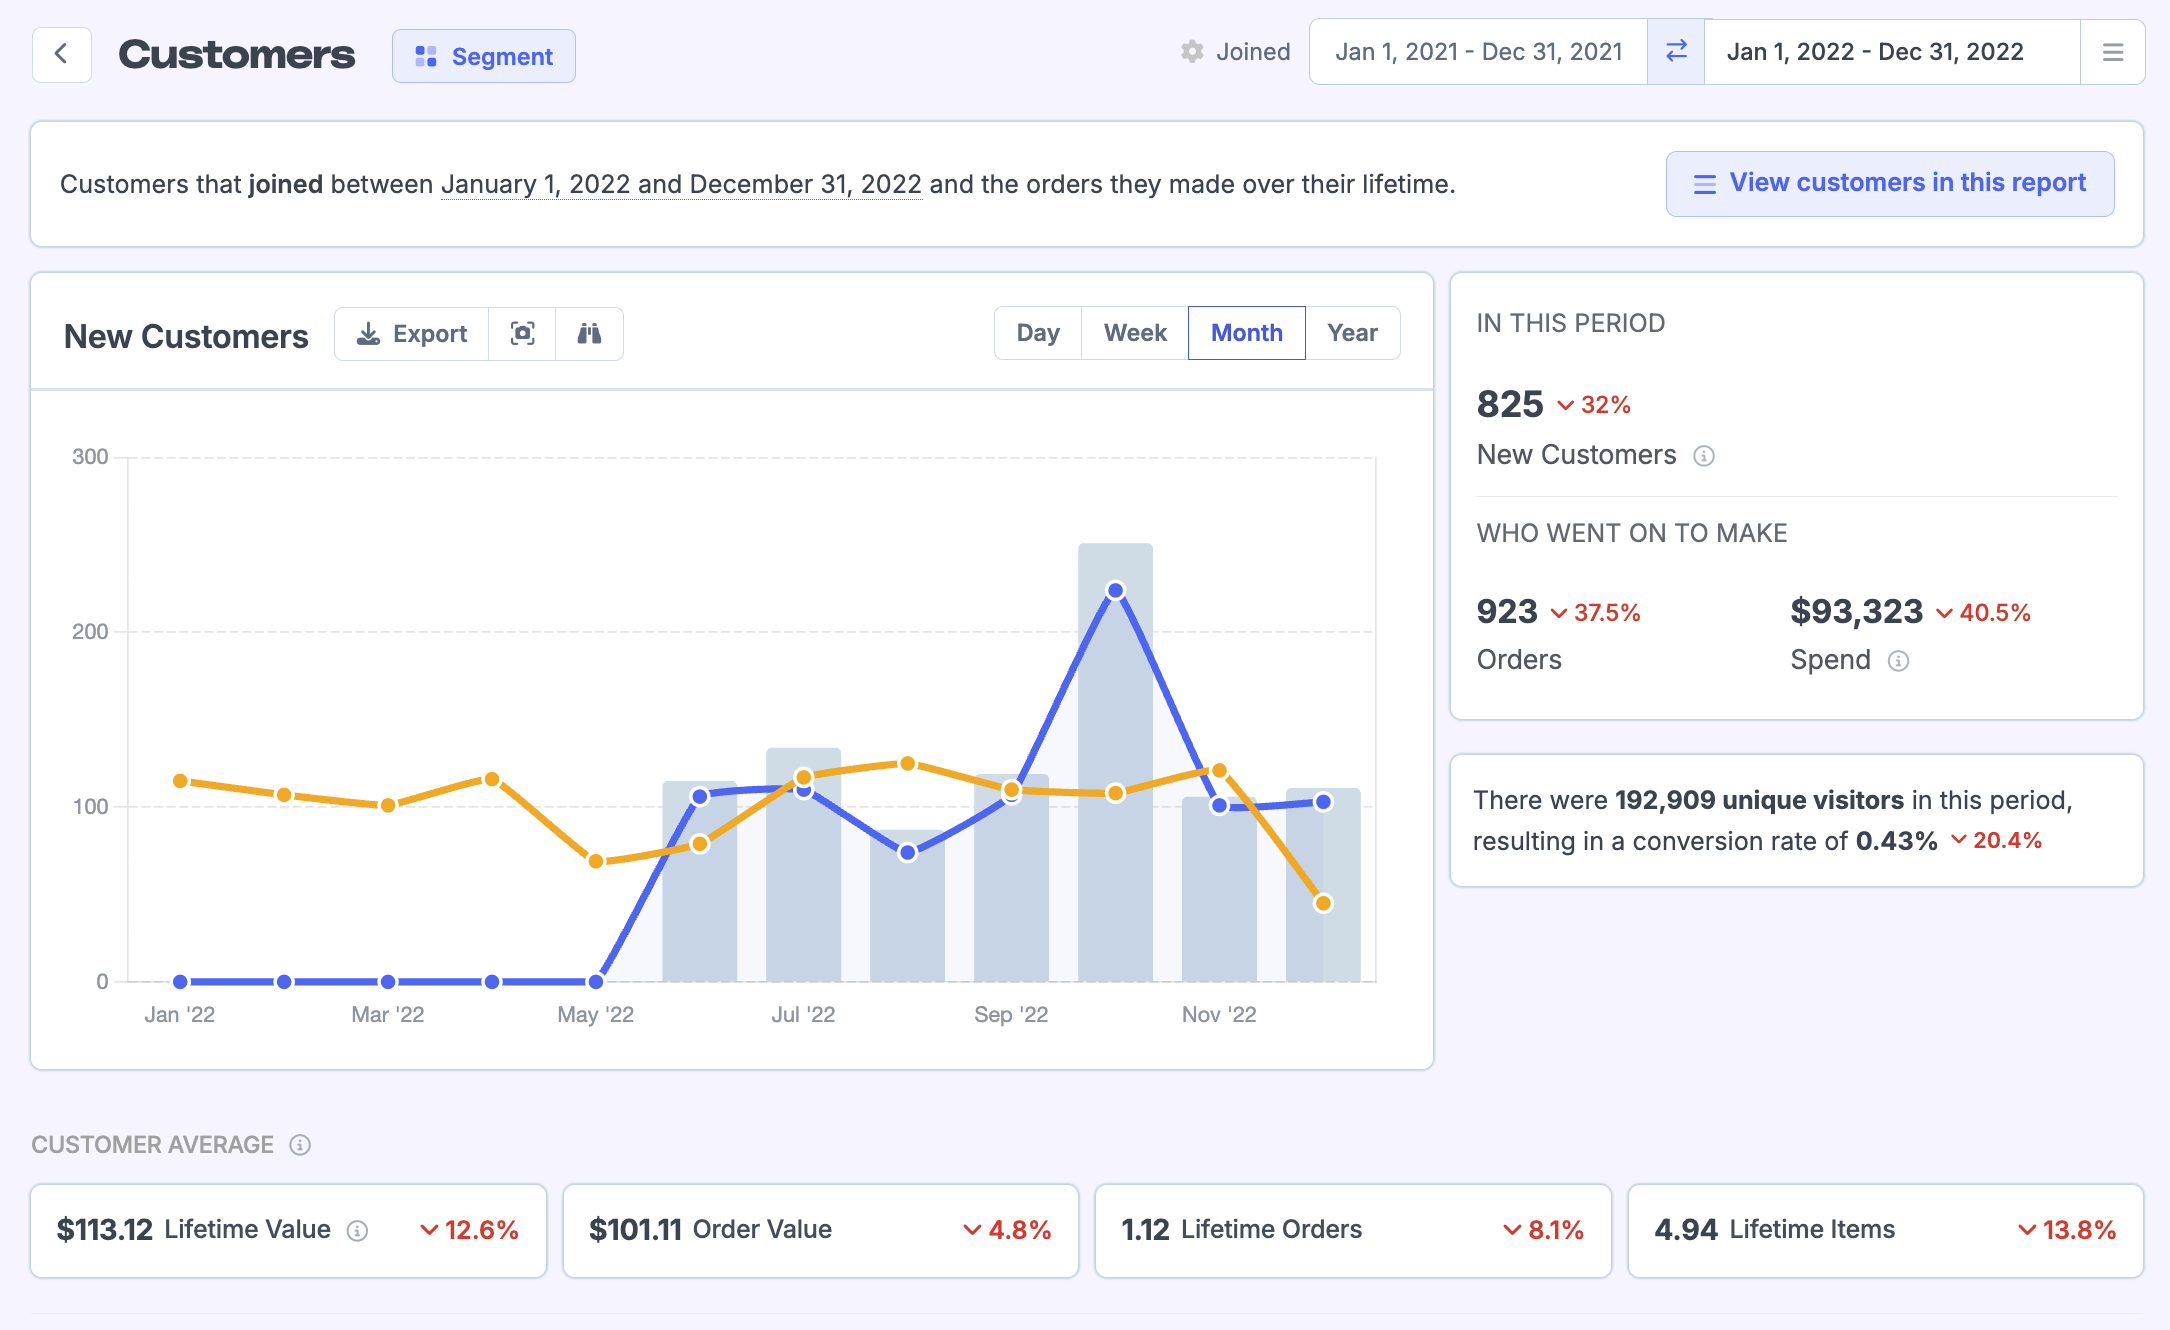
The Customer Report gives you an overview of the current state of your customers in Metorik:
First order date or join date
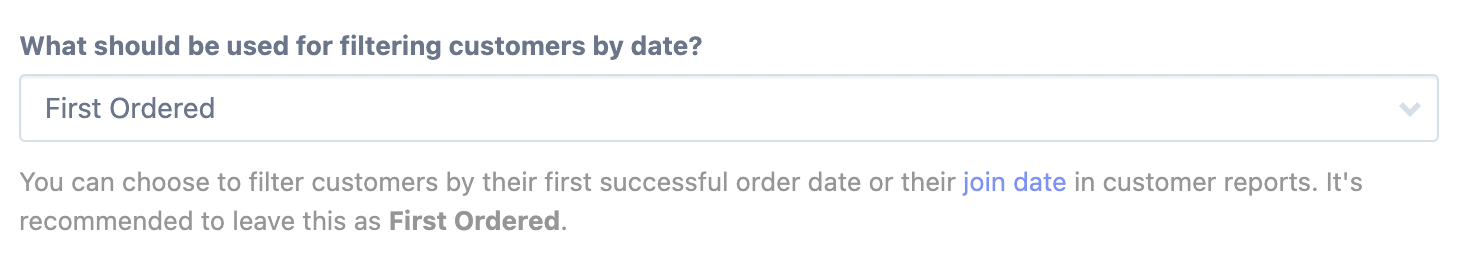
By default, all customer reports will filter customers based off the first successful order date. We've found this to be the most reliable way to look at customer reports.
If you'd like, you can base it off the join date instead, by changing it in the store date settings:
For example, there's a customer who joined your store (made an account) on March 20th, 2022. Then a few days later on March 24th, 2022 they made a successful order.
First Ordered: March 24th, 2022.
Joined: March 20th, 2022.
So by default, this customer will be included in the report under March 24th, 2022, but if you'd like, you can have them included under March 20th, 2022.
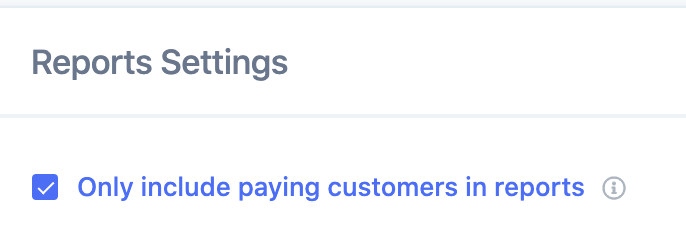
Paying customers
You can control if only paying customers should be included in customer reports by using the store report setting:
Understanding the Customer Report
The interpretation of the metrics in the screenshot above is as follows. In the period of 1 Jan 2022 - 31 Jan 2020:
146 new customers ordered for the first time.
These 146 new customers went on to make 148 orders.
The sum of these orders totals to $14,569.
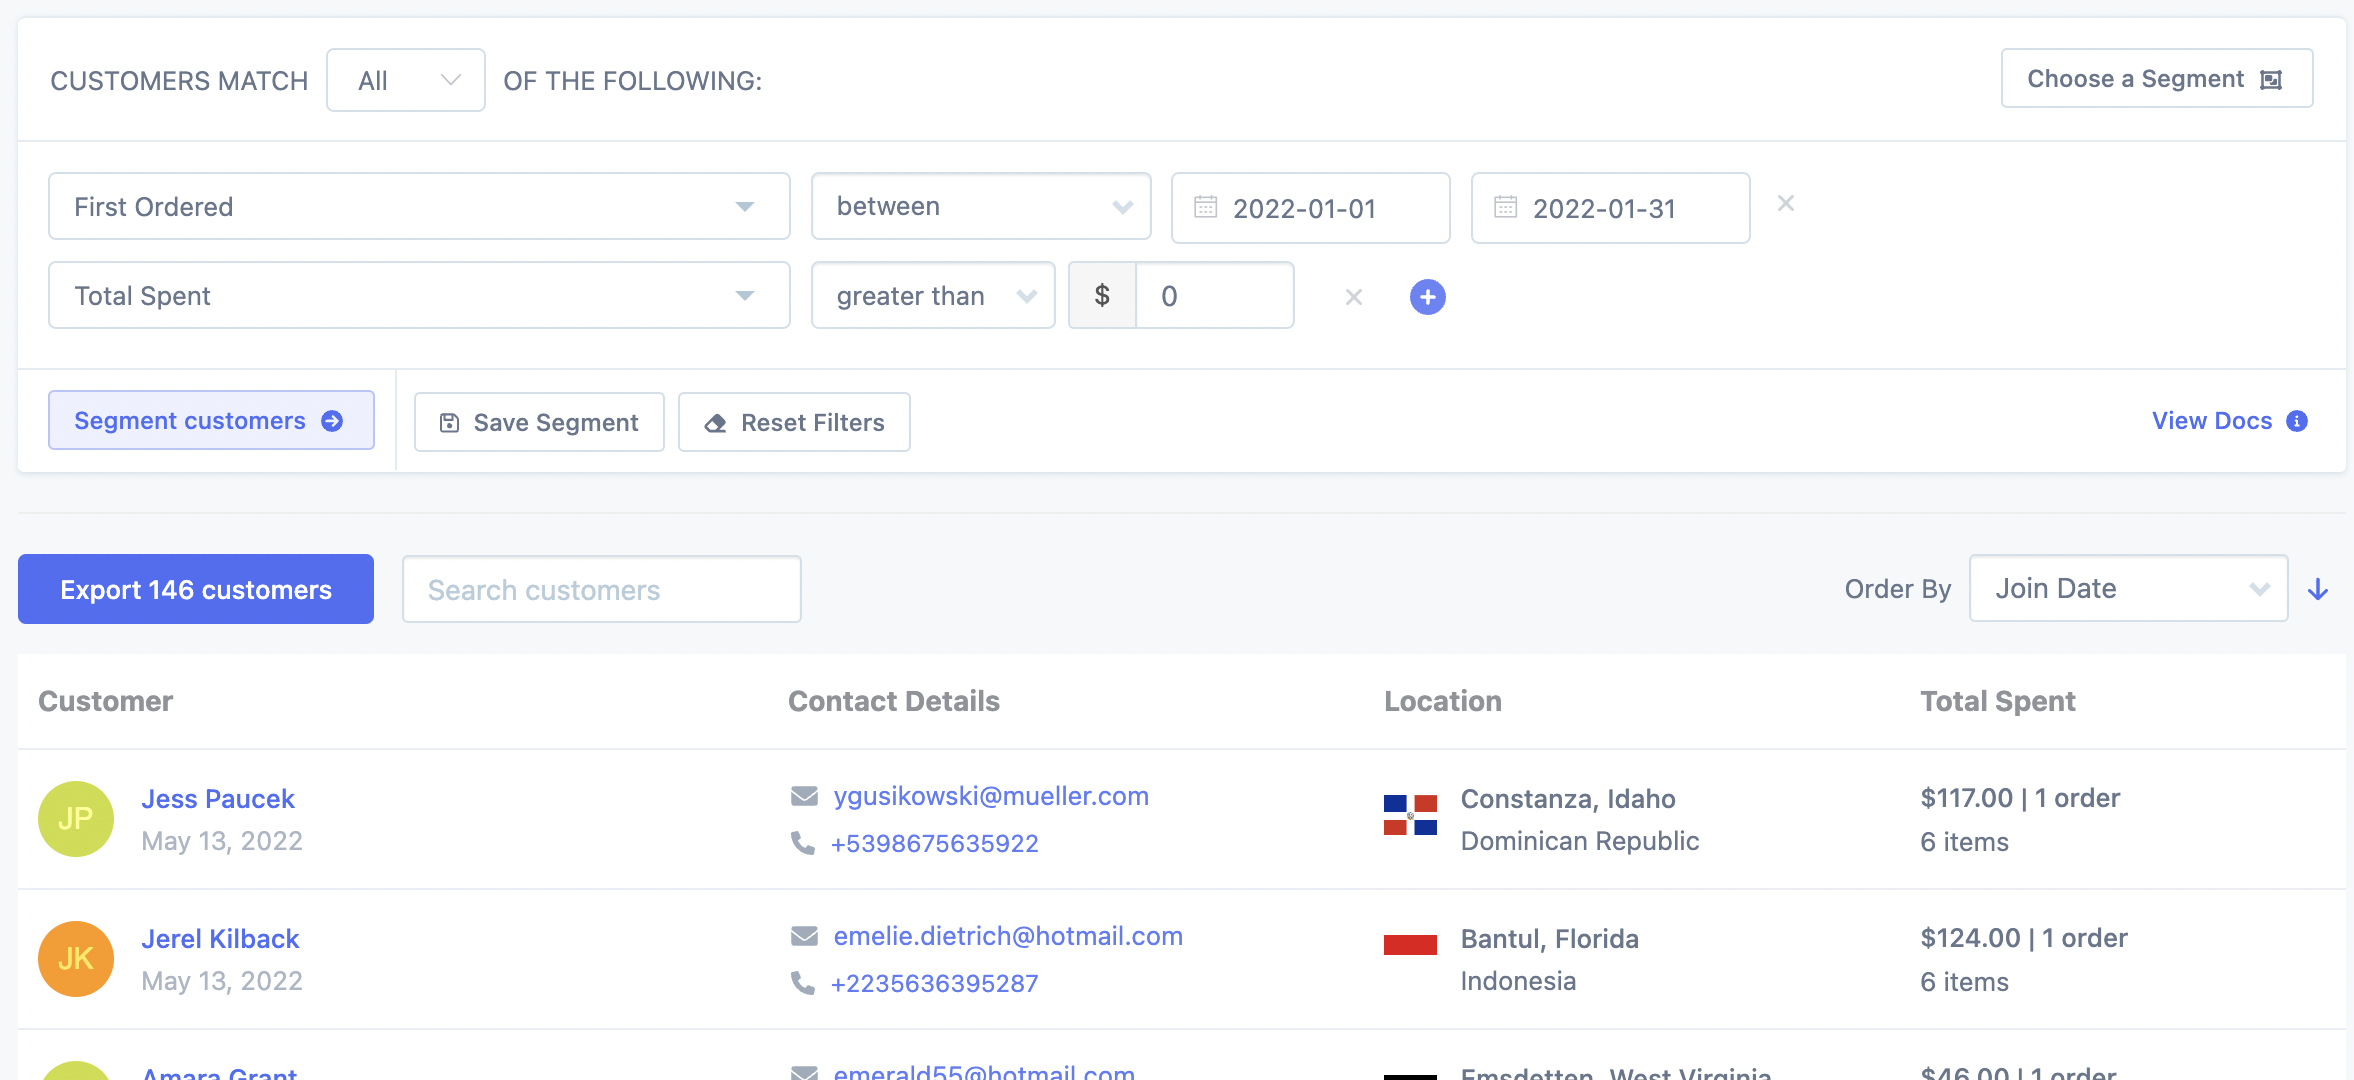
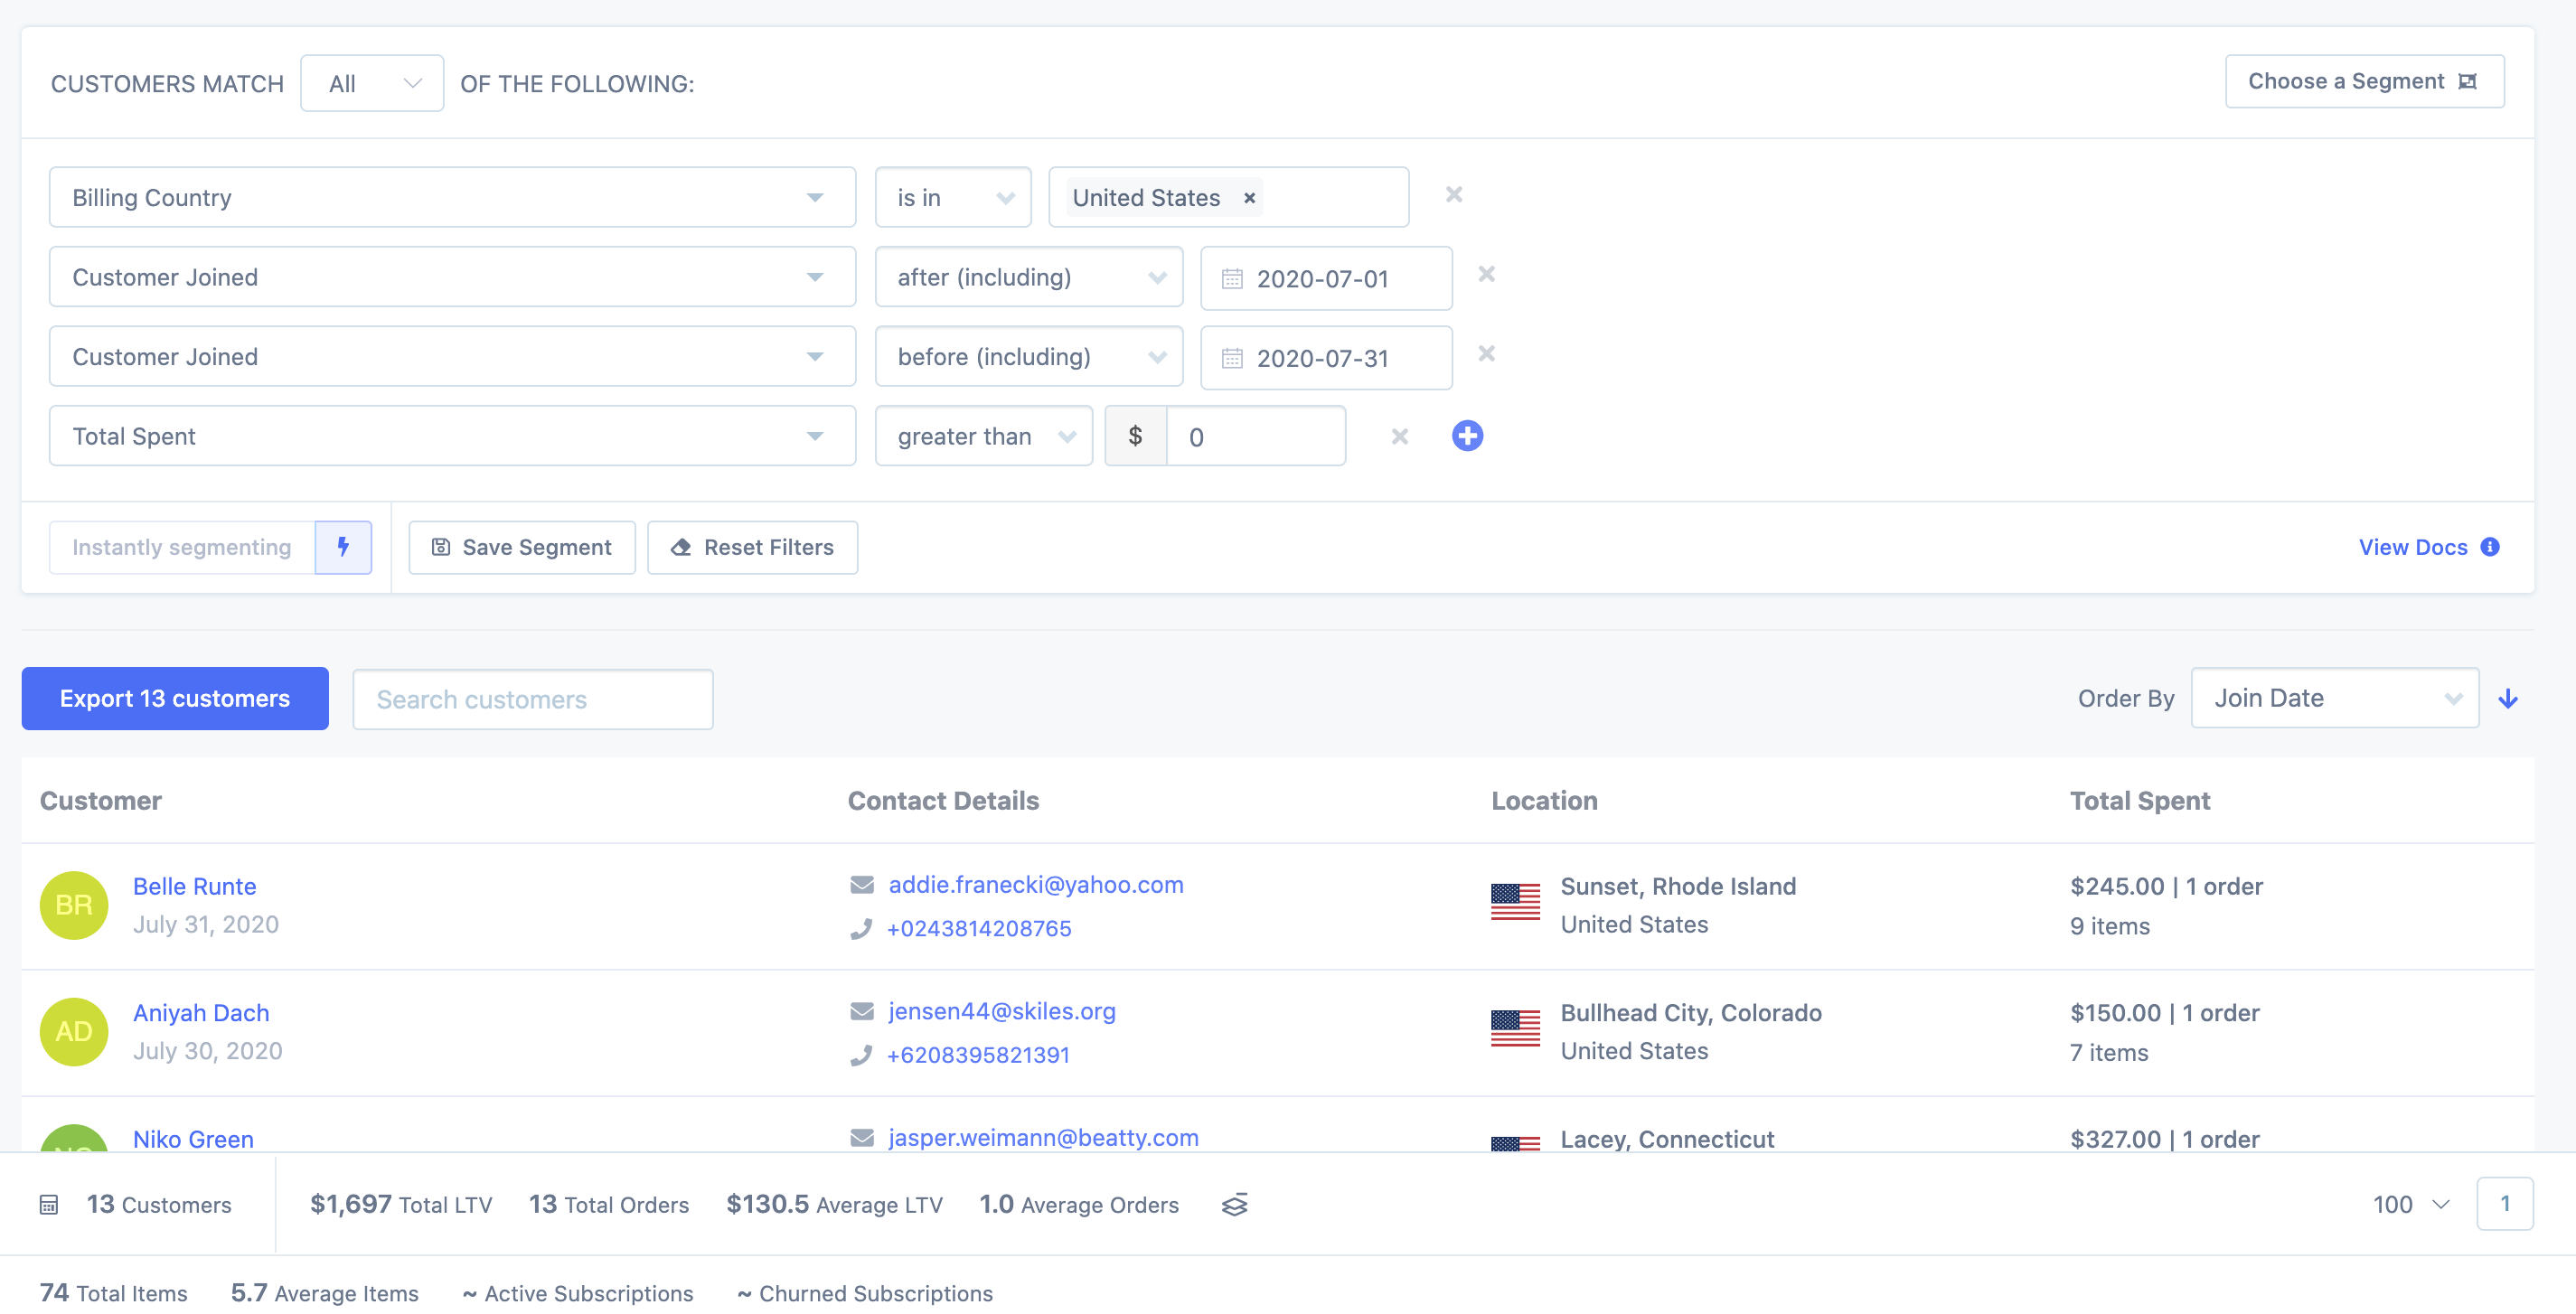
You can dig even deeper into these figures by clicking the view customers in this report button:

This will take you to your customers segmenting page and apply the filters to create this segment of customers:
And for a detailed walkthrough of seeing how many new customers you have acquired in a given period, check out this doc.
Customer averages
These metrics give you an idea of the averages of the customers you are looking at:

Average lifetime value (LTV): Takes the total spend figure at the top and divides by number of customers. In this case, 13,282/120 = $110.68.
Average order value: Takes the total spend figure at the top and divides by number of orders. In this case, 13,282/120 = $110.68.
Average lifetime orders: Takes total orders and divides by number of customers. In this case, 120/120 = 1.
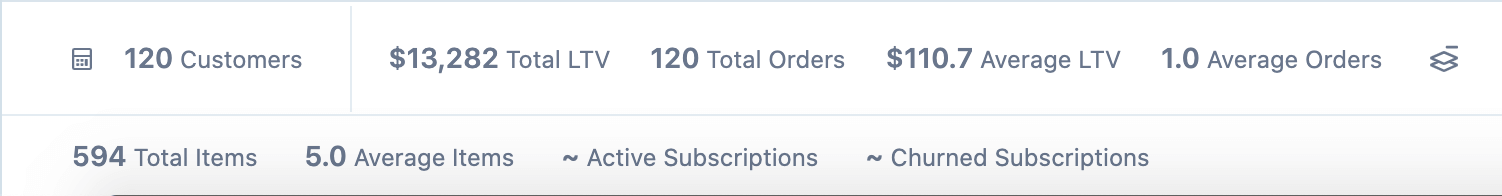
Average lifetime items: Takes total number of items purchased by customers and divides by number of customers. In this case, 594/120 = 4.95. You can see the total items in the stats bar at the bottom of the customers segmenting page:
Customers grouped by
The customers grouped by sections break down the initial segment of customers even further. It breaks it down into:
Role
Billing country/state/city/zip
Shipping country/state/city/zip
There are even more metrics available to you in the export; just click the export button:
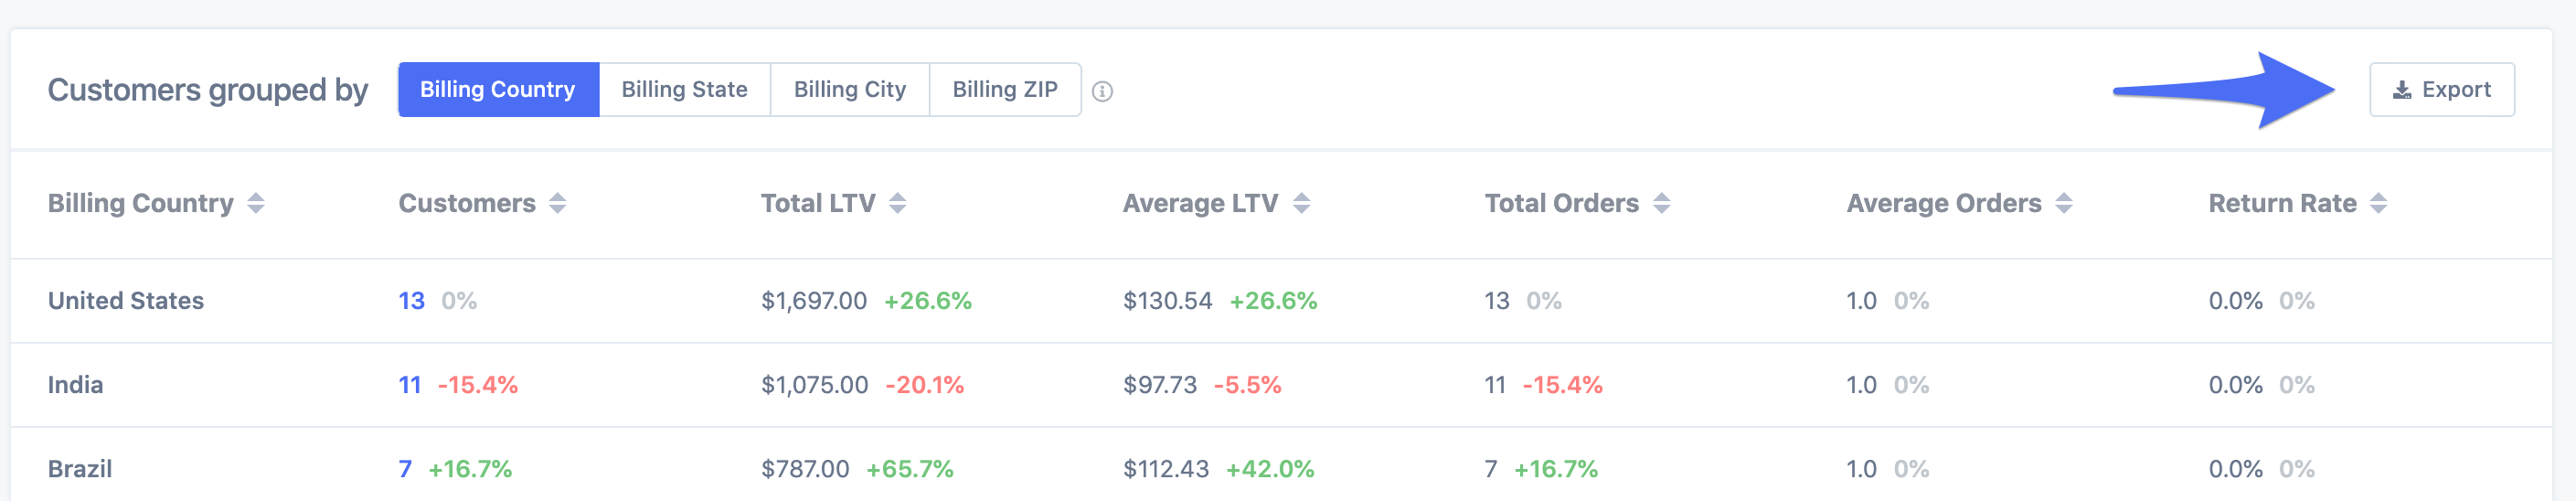
For example, you can find the tax breakdown in the shipping/billing exports.
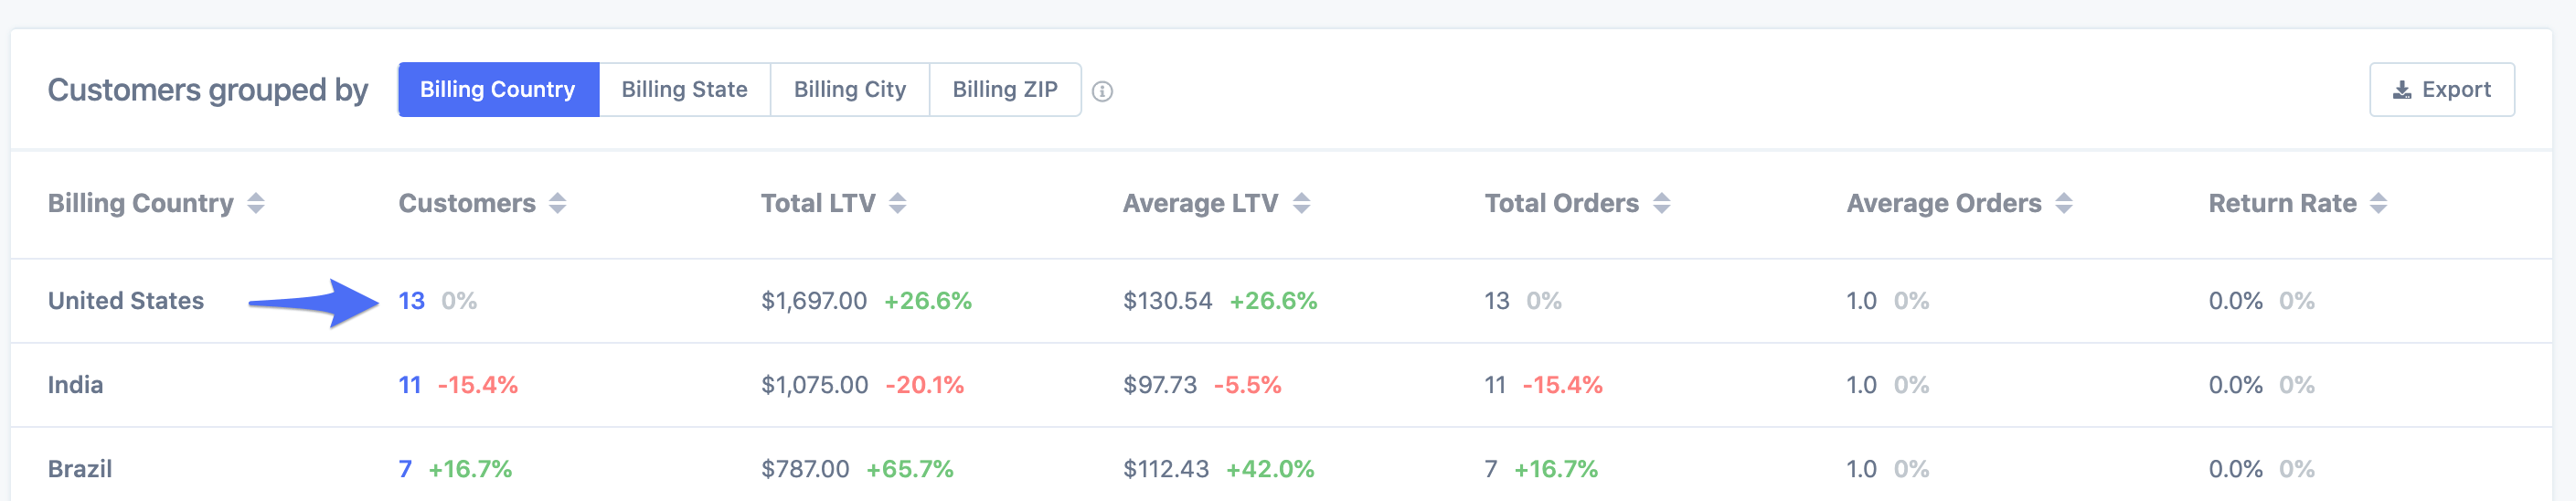
You can also click on the blue number in the customers column to see the list of customers in that segment:
Customer Heatmap
Click the Show Heatmap button to see a beautiful visualisation of where your customers are located in the word:
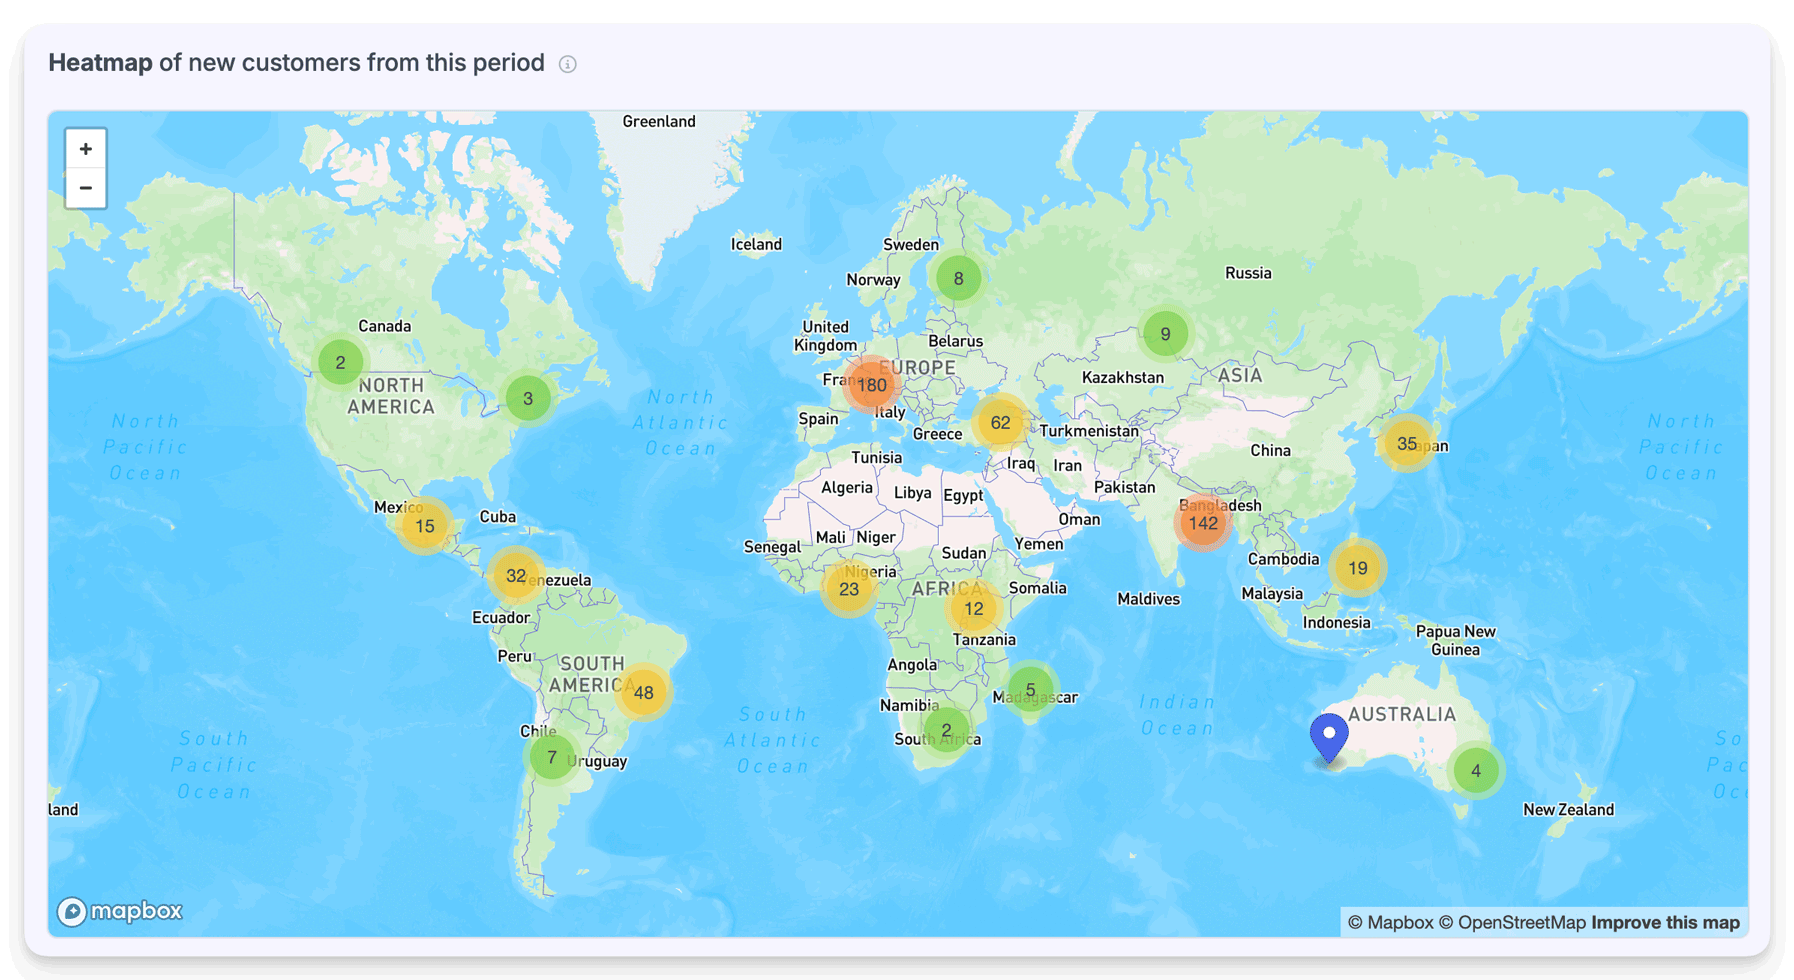
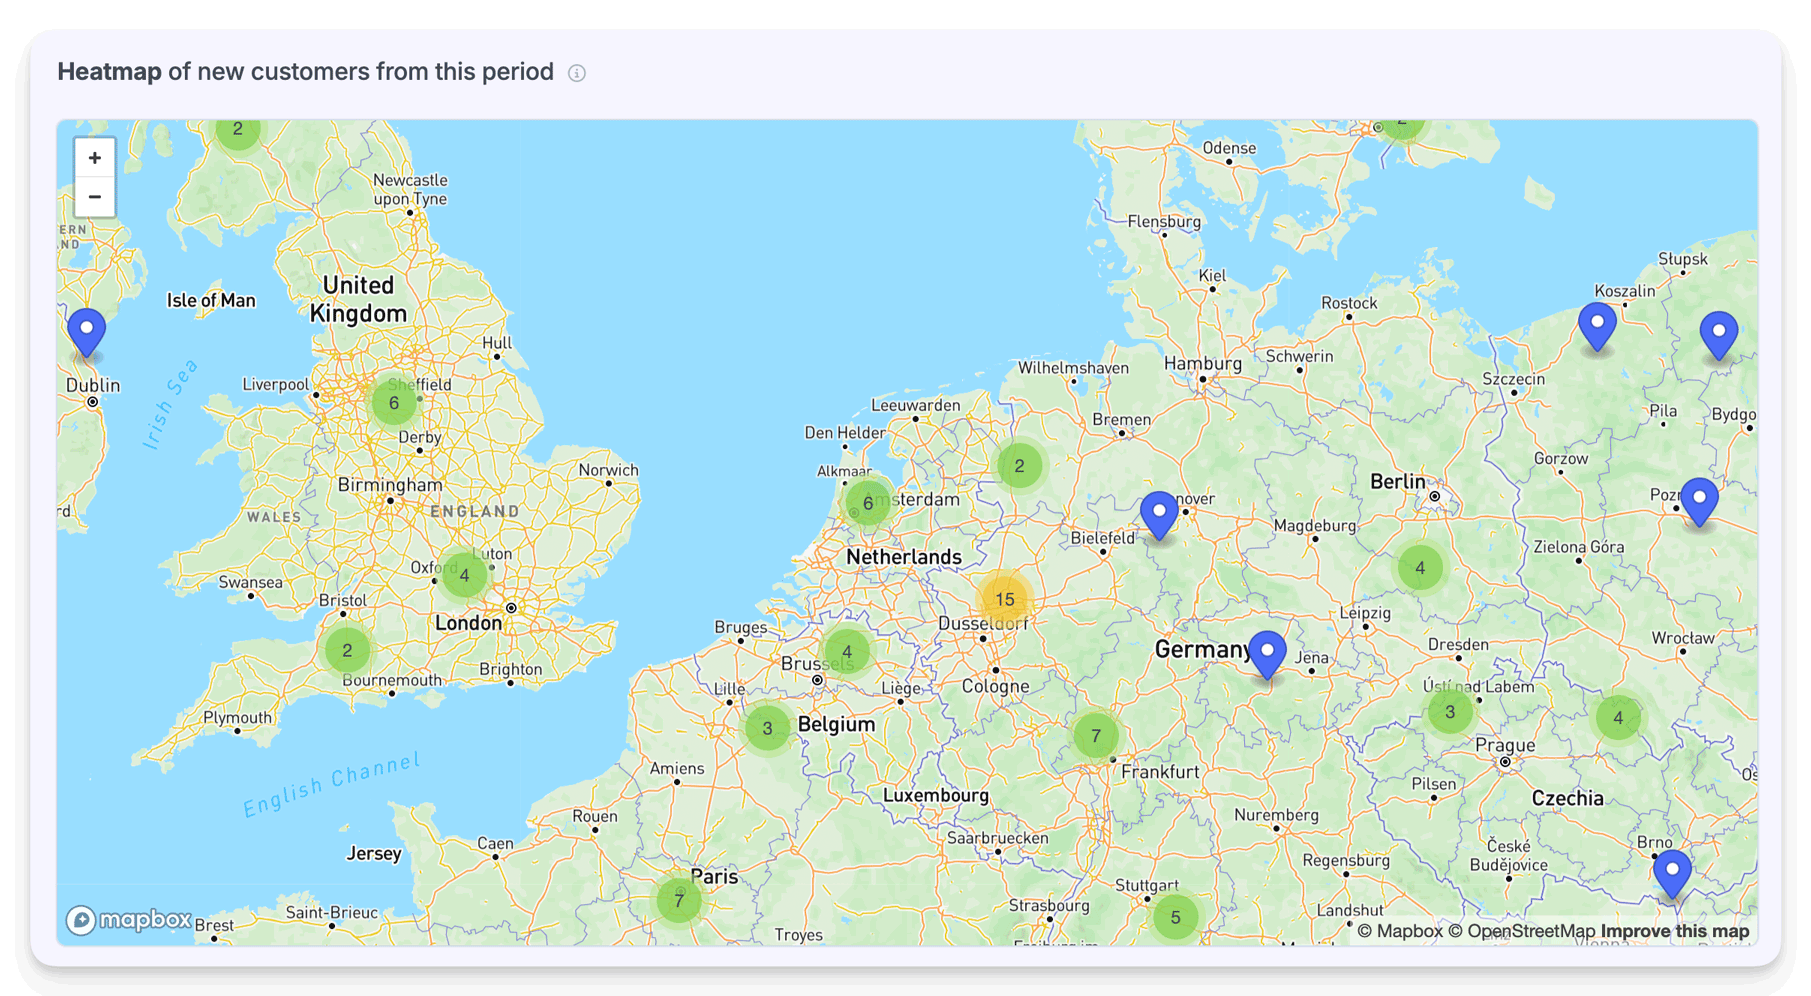
You can scroll or click the cluster markers to zoom in on the map to see a more granular breakdown of location:
The Customer Retention Report
While the Customer Report looks at the KPIs and metrics of customers who first ordered in a specific period, the Customer Retention Report looks at how well you retain these very customers:
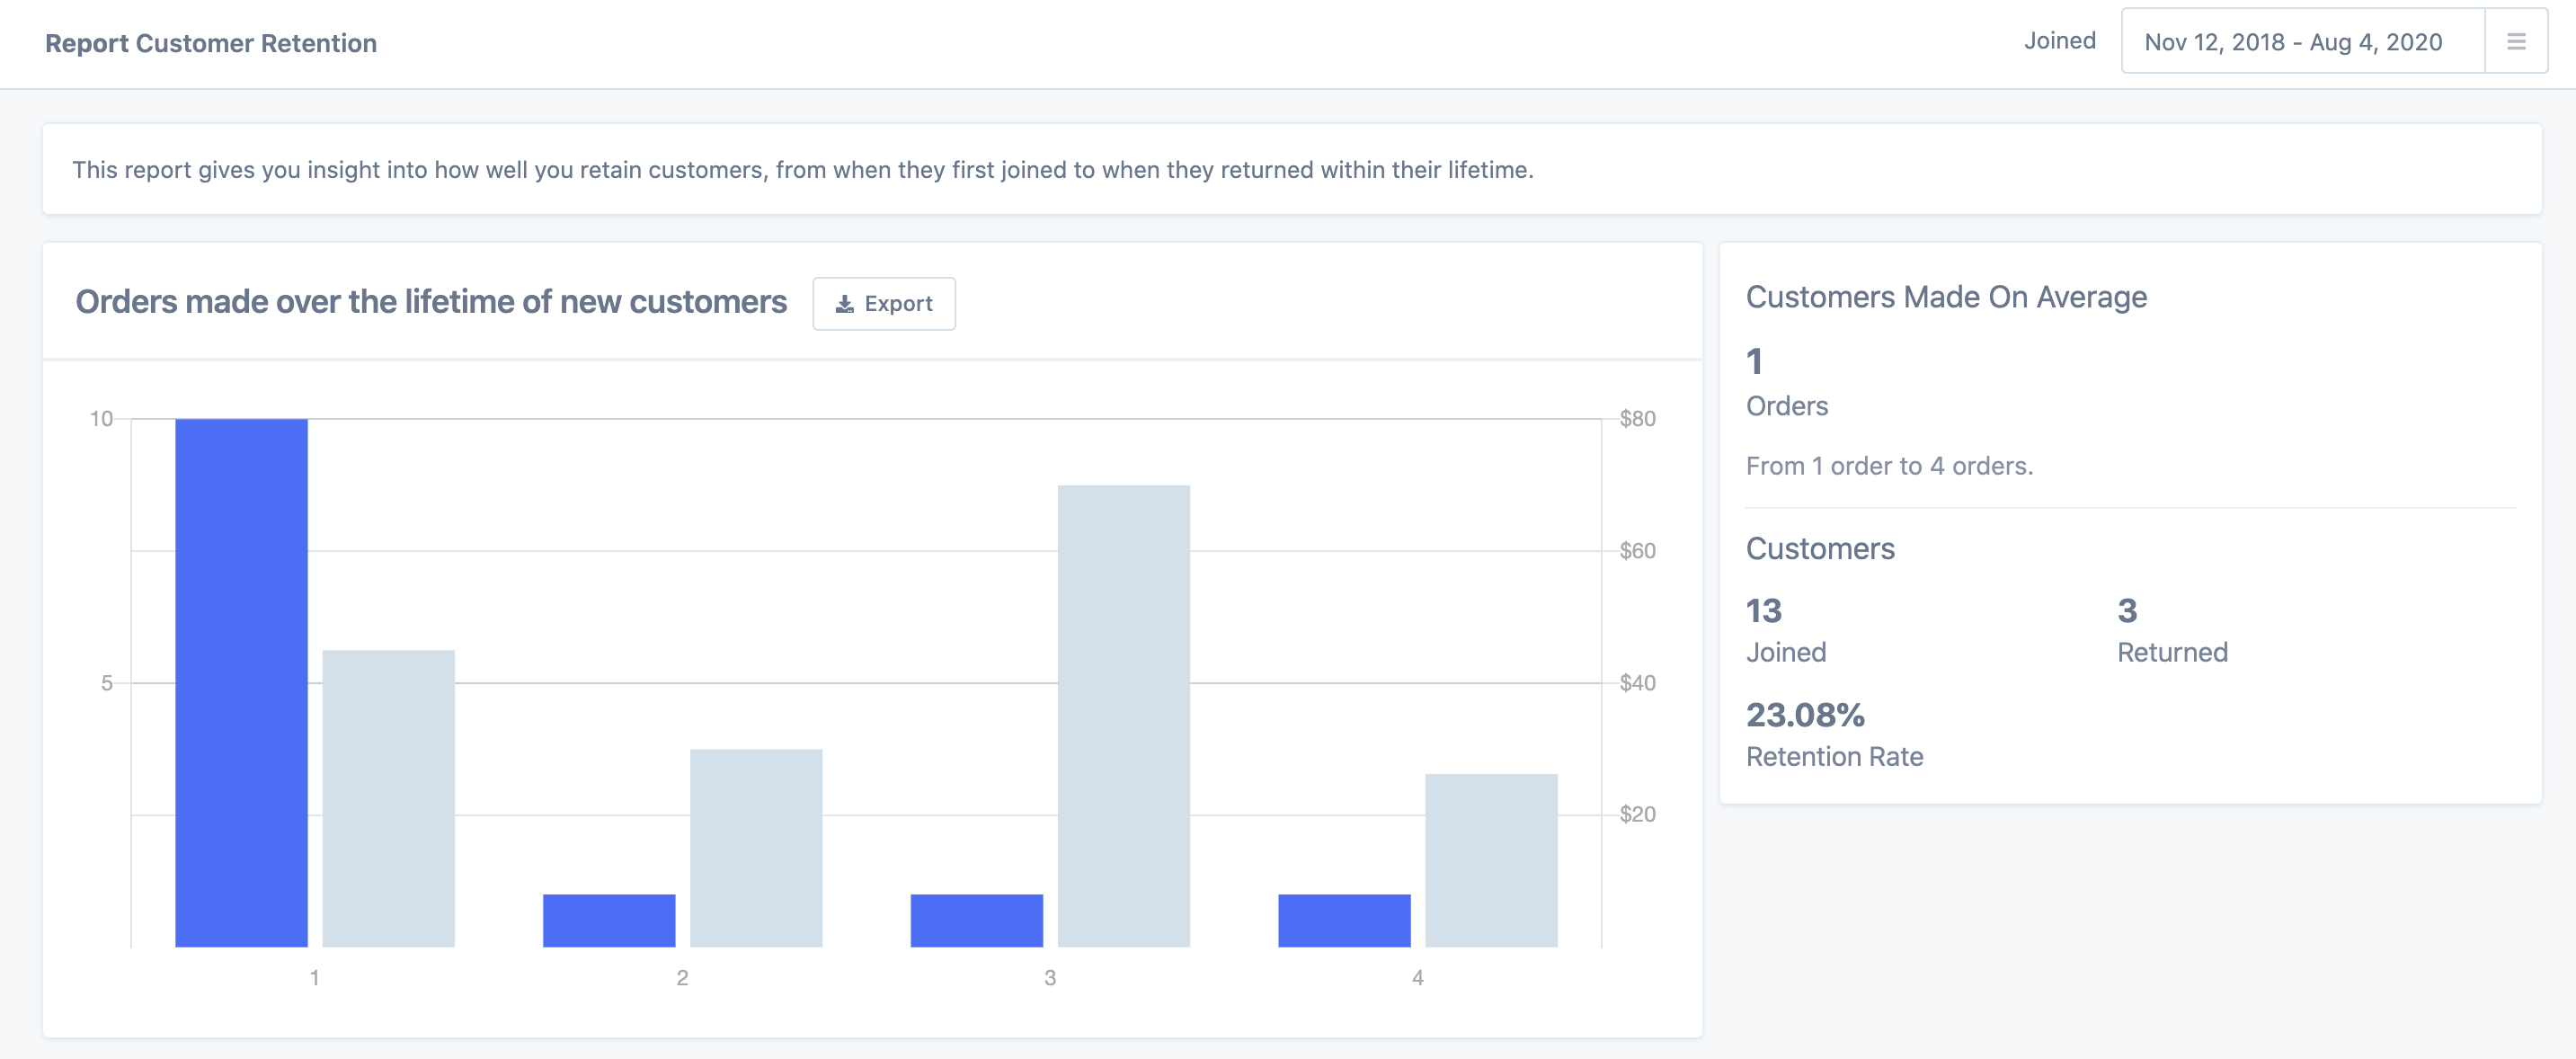
So for example, in the lifetime of this store (November 2018 - August 2020) there have been a total of 13 customers. Out of those 13 customers, 3 have made a second purchase.
The retention rate is therefore 3/13 x 100 = 23.08%
You can see a further breakdown of this below:
Orders made over the lifetime of new customers
This bar chart on the left will give you a further breakdown of how many orders customers made over their lifetime and the corresponding average order gross:
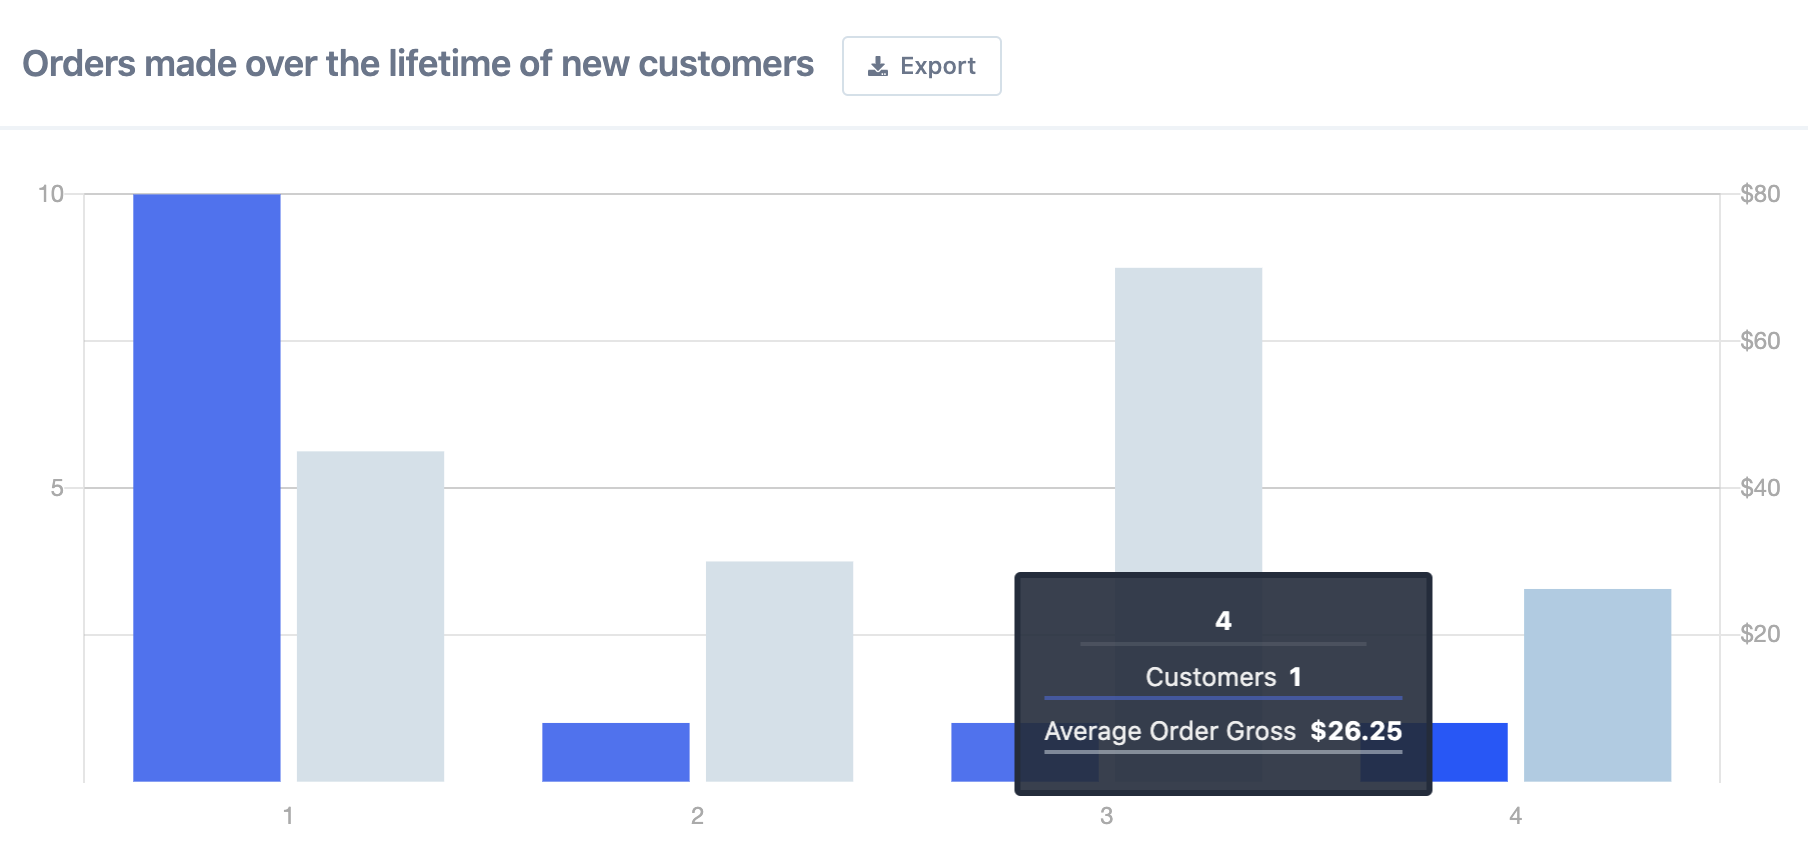
So for example, 1 customer made 4 orders.
Time between repeat orders
This chart looks at how much time has elapsed between each repeat order:
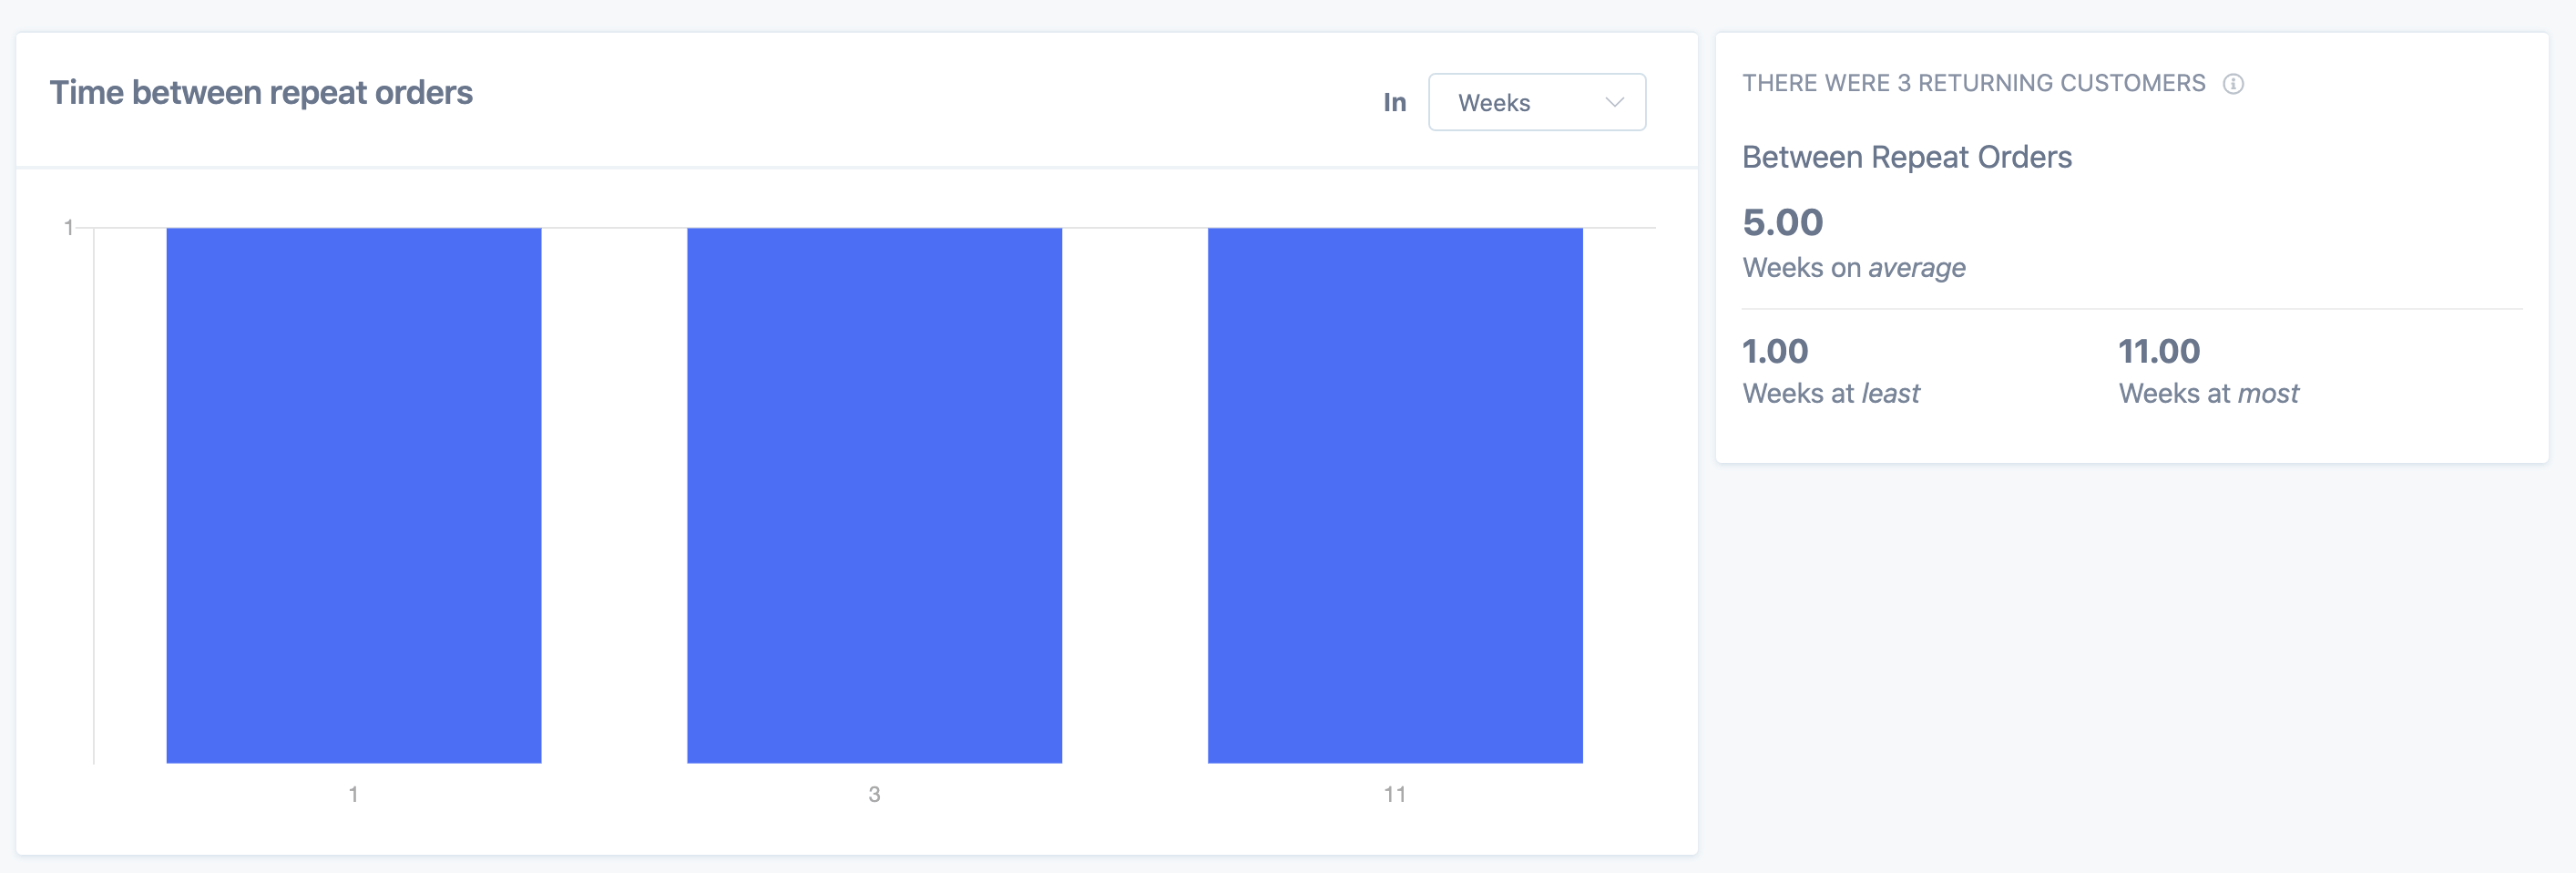
So we know that for this store there were 3 returning customers. For those returning customers:
1 customer waited 1 week until their next order.
1 customer waited 3 weeks until their next order.
1 customer waited 11 weeks until their next order.
You can change the units from weeks to days/months/years by selecting from this dropdown:
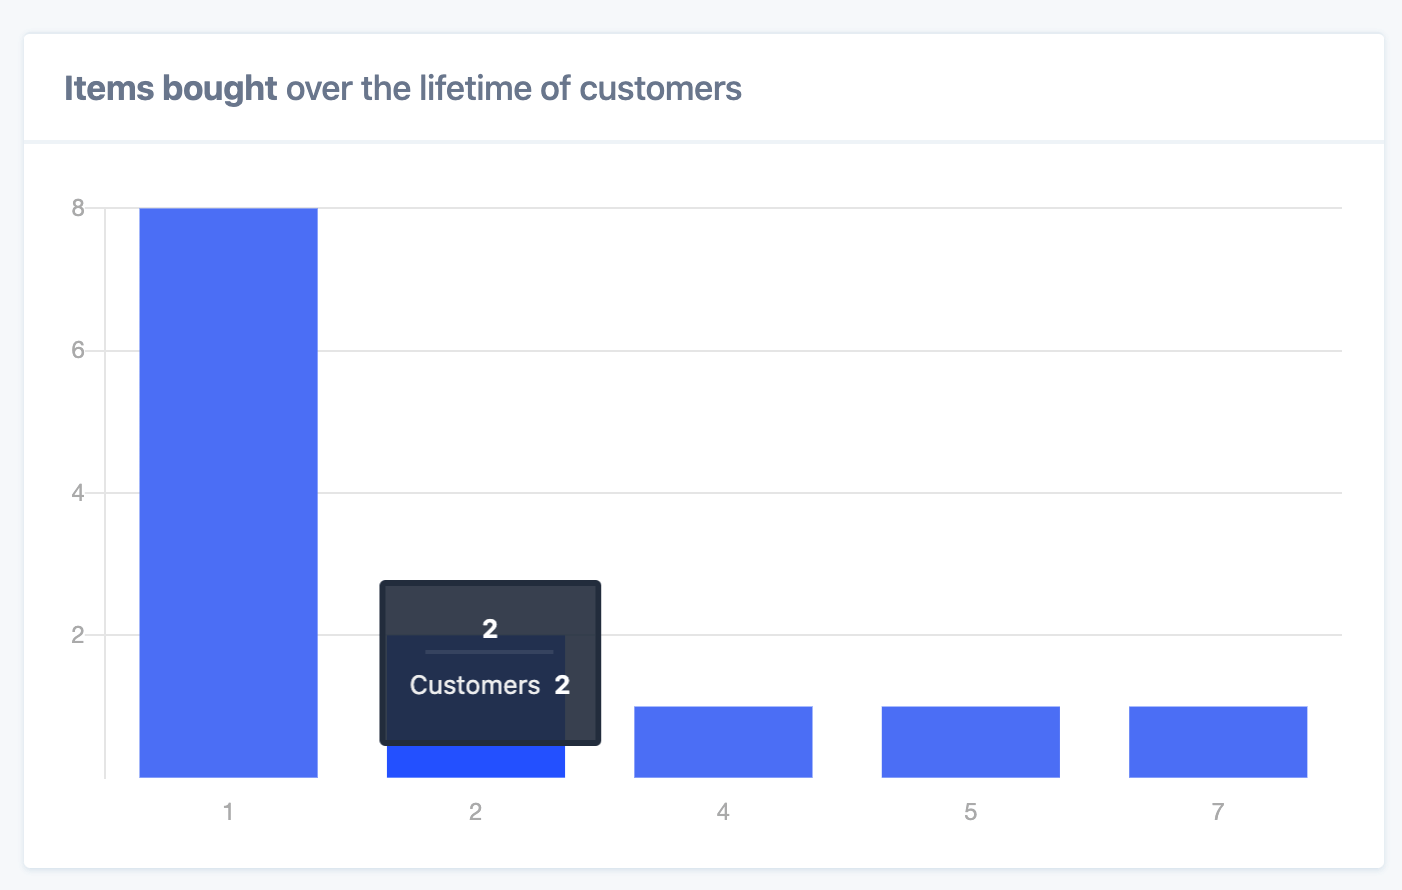
Items bought over the lifetime of customers
This chart looks at how many items were purchased over a customer's lifetime. So for example, 2 customers purchased 2 items over their lifetime: