Customer Cohort Reports
Cohort reports allow you to see how different customer groups behave over their lifetime. Metorik's cohort reports allow you to choose the grouping method for each cohort; join month, billing country, first product purchased, and first coupon used. Then each different cohort report will allow you to see the purchasing behaviour of the cohort grouping you have selected.
If you are a visual learner, check out this video which summarizes this doc:
How to use the cohort reports
This example uses the Average order value cohort report to explain how the cohort reports work in general. There are many other cohort reports which we will talk about later in this help doc.
Click here to jump to a list of all cohort reports
Each cohort report has a few different components:
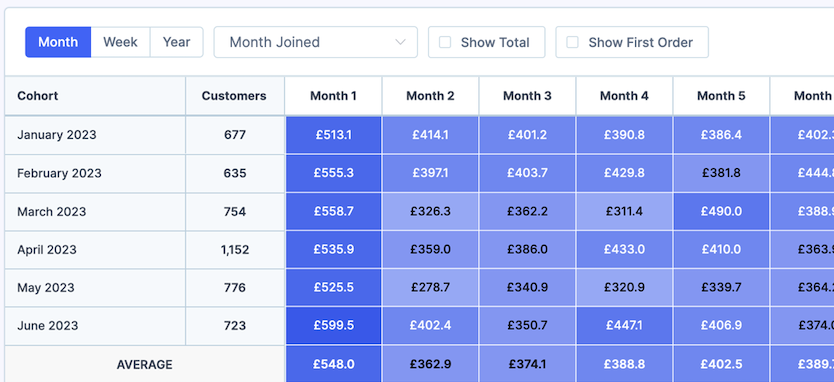
The Cohort column shows you each of the cohort groups. This will change depending on the grouping method you have selected. In the screenshot above, since we have selected month joined the column shows the months in the selected period.
The Customers column tells you how many customers belong to that cohort; in January 2023, we had a total of 677 customers join the store. In February, 635 customers joined the store, etc..
The next columns will change depending on which cohort report you are looking at, but for this report, they are broken into subsequent months (or weeks/years, we will learn about this below). So in this screenshot in the 2nd row (January 2023 cohort), Month 1 = January 2023, Month 2 = February 2023, Month 3 = March 2023, etc...
You will also see a number of buttons at the top of the reports (which will change depending on the cohort report):
Period grouping

This allows you to change which time period is used to group the cohorts and the subsequent columns. By default, it's monthly (like above). But you can change the group to weekly or yearly:
Cohort grouping
This allows you to change how the actual cohorts are grouped. So far, we have seen grouping by the join month, but we can group by the customers' billing country, first product purchased, or first coupon used:
Number or percentage

This allows you to change whether the report shows absolute numbers or percentages. This won't show on all reports.
Export

The export button will export the cohort to a CSV if you would like to further analyze the data in Google Sheets or Excel.
Understanding the Cohort Report
Each report has different data and will give you different insights, but they are all read similarly.
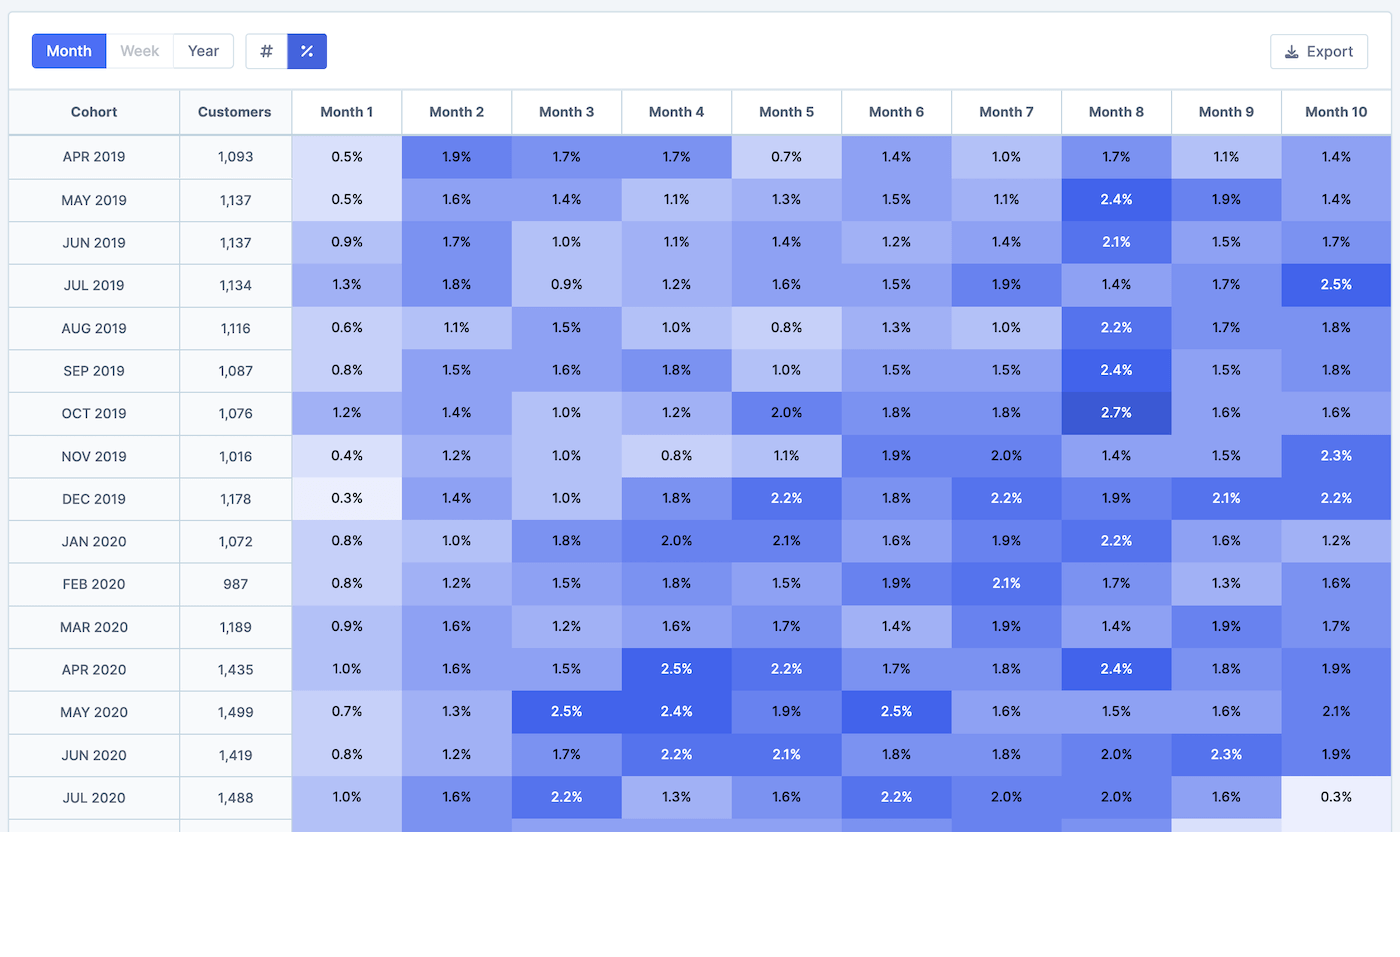
This screenshot is from the Return customer rate cohort. This report shows the number/percent of customers that returned to make another order in each following month after they first ordered:
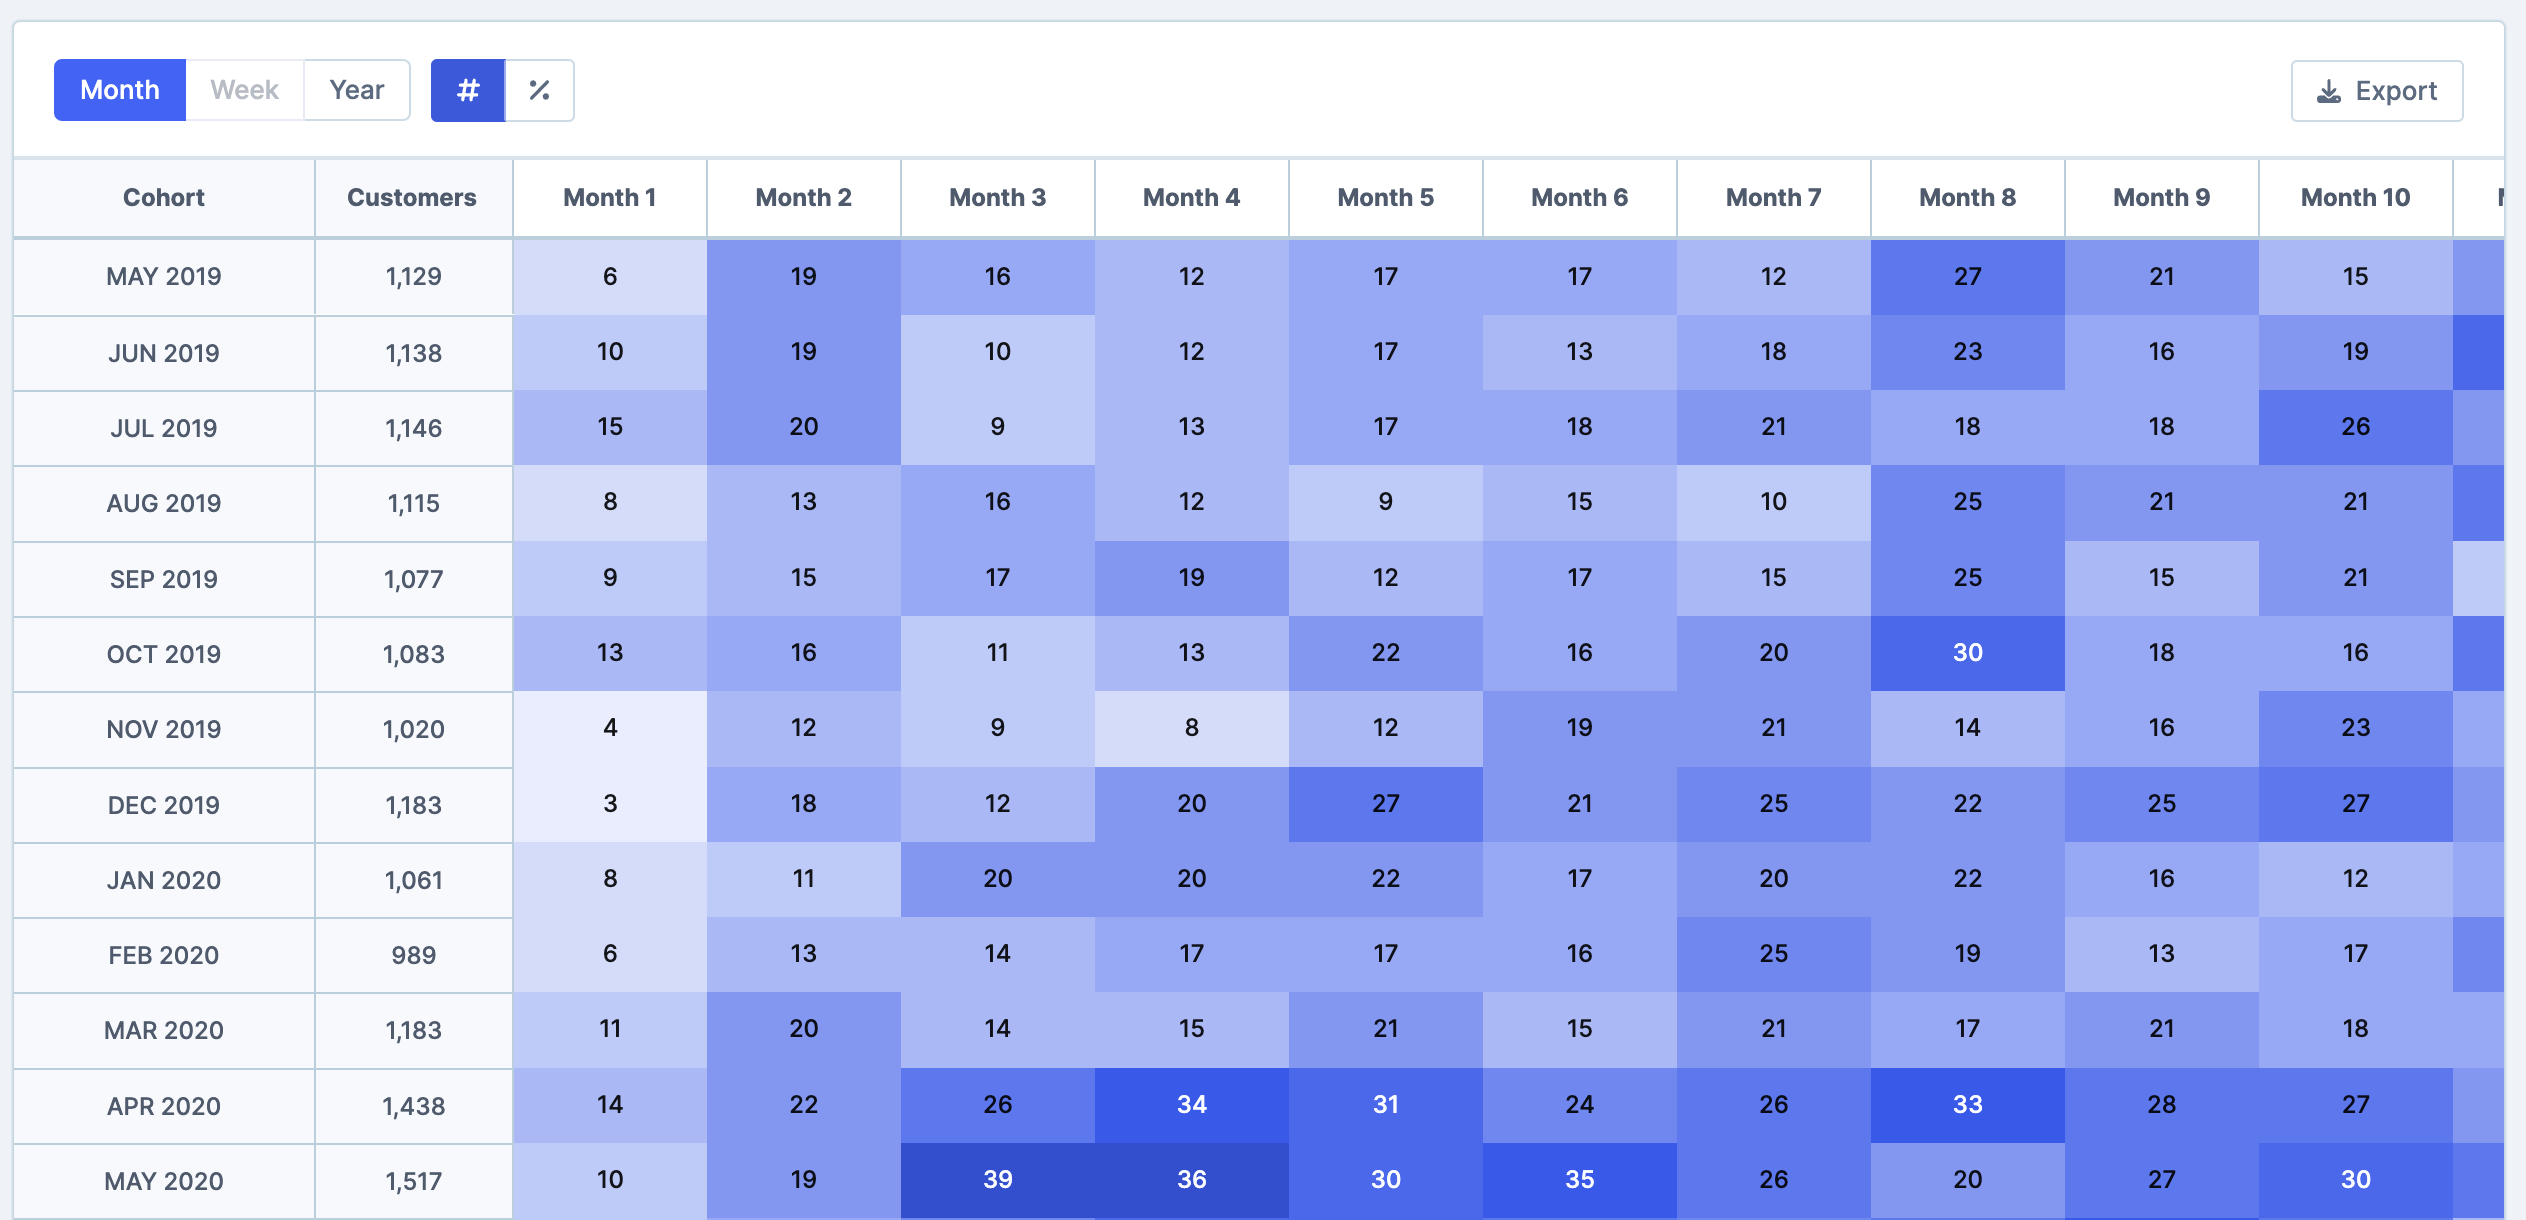
We can interpret the data as follows:
In May 2019, 1,129 customers ordered from our store.
In May 2019 (Month 1), of those 1,129, 6 customers ordered again. In June 2019 (Month 2), 19 of those customers ordered again. We know more customers ordered in Month 2 just by glancing because the shade of blue for that cell is darker.
If you hover over the cell, the report will tell you how to interpret the data too:
Summary Stats
Some of the reports will also have some data at the top of the page, so you can easily see a summary of the table.
So for the return customer rate cohort, you will see this:
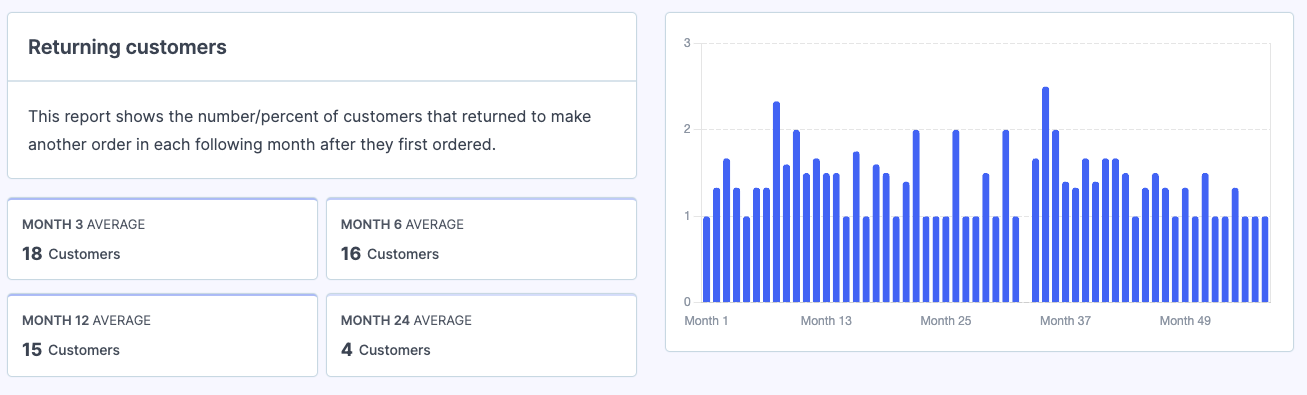
The cards and chart show you the averages for each month across all the cohorts. So for the Return customer rate cohort, in month 3, 18 customers are returning to make an order on average. If you scroll down to the bottom of the cohort, you will see this figure too (the third column is 18).

The chart shows the same figures, just for every single month.
Digging Deeper into the data
Just like with most of the reports in Metorik, you can segment the cohort reports to see niche segments of your customers. For example, when looking at returning customers, we can filter the report to only show customers who have purchased from a certain category:
This is just one simple example, but the sky is the limit with the types of segments you can create.
Types of Cohort reports
In this section we will give you an overview of all the cohort reports in Metorik.
Return customer rate
This report shows the number/percent of customers that returned to make another order in each following month after they first ordered.
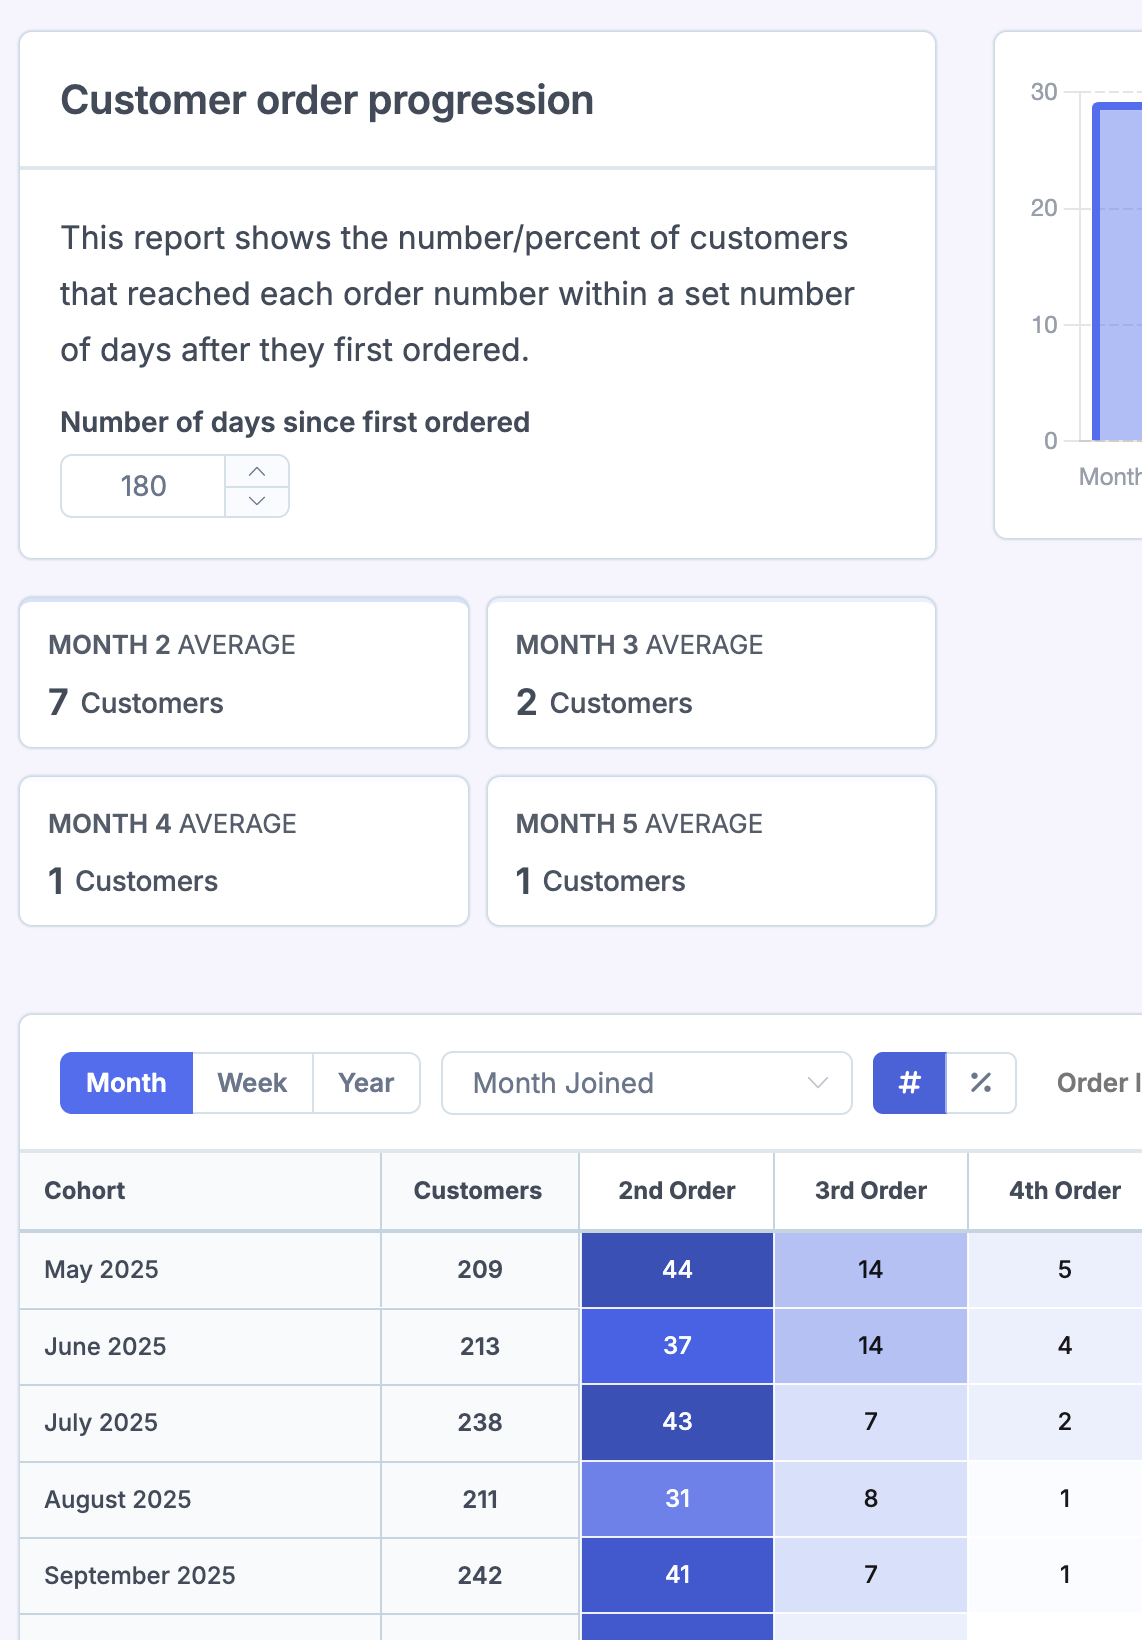
Customer order progression
This report shows the number or percent of customers that reached each order number (2nd order, 3rd order, 4th order, etc.) within a set number of days after they first ordered.
You can configure the time window using the Number of days since first ordered setting (default is 180 days). This lets you analyze how quickly customers progress through their repeat purchases.
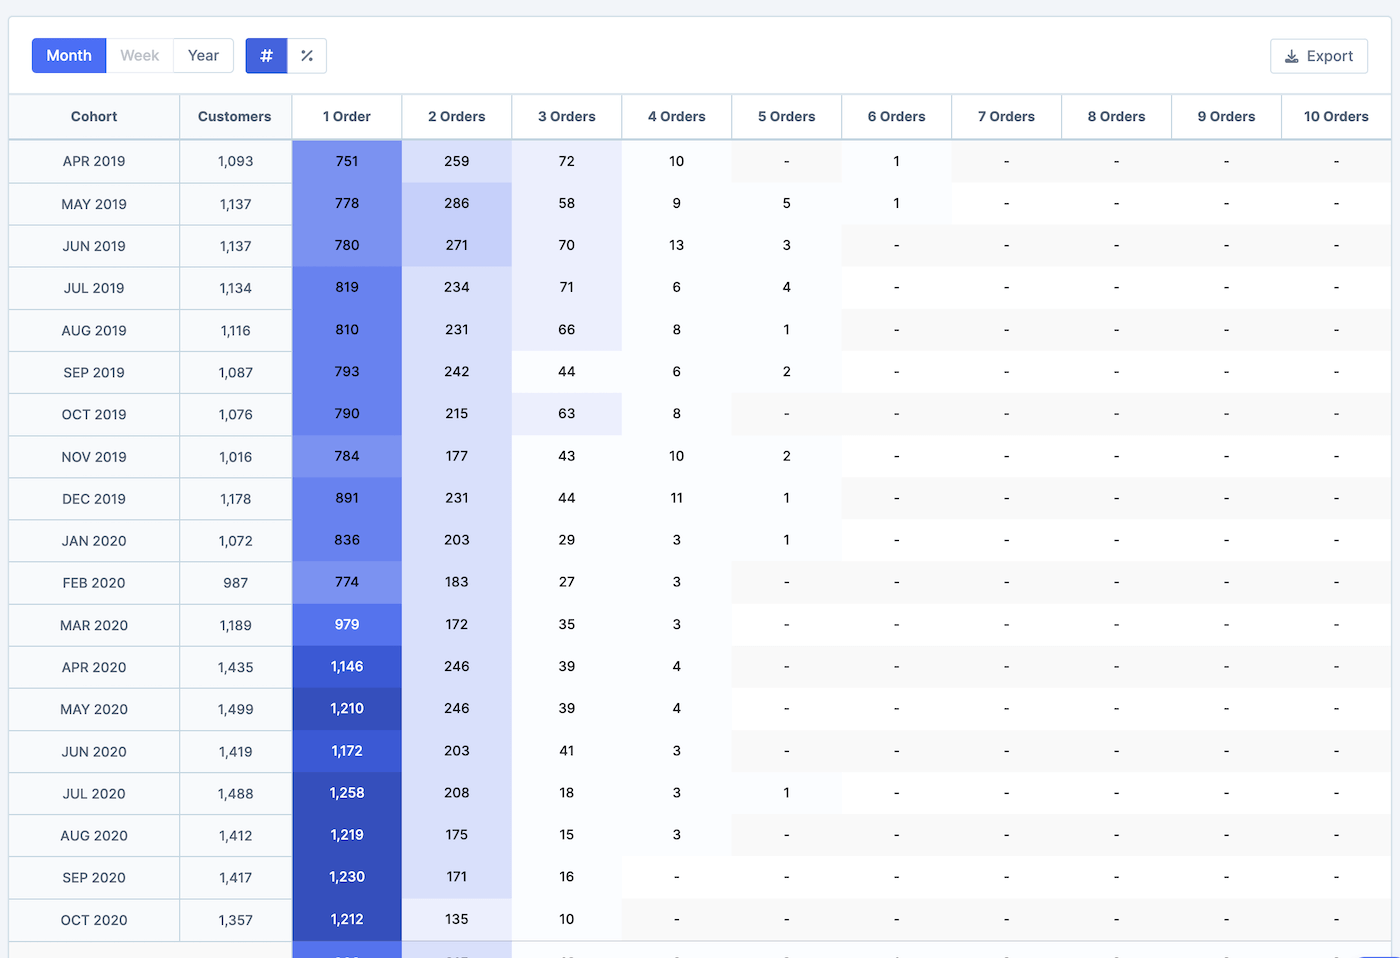
Customers by order count
This report shows the number/percent of customers grouped by their total order count for each cohort.
Note: In this report, the columns are broken down by number of orders instead of subsequent months.
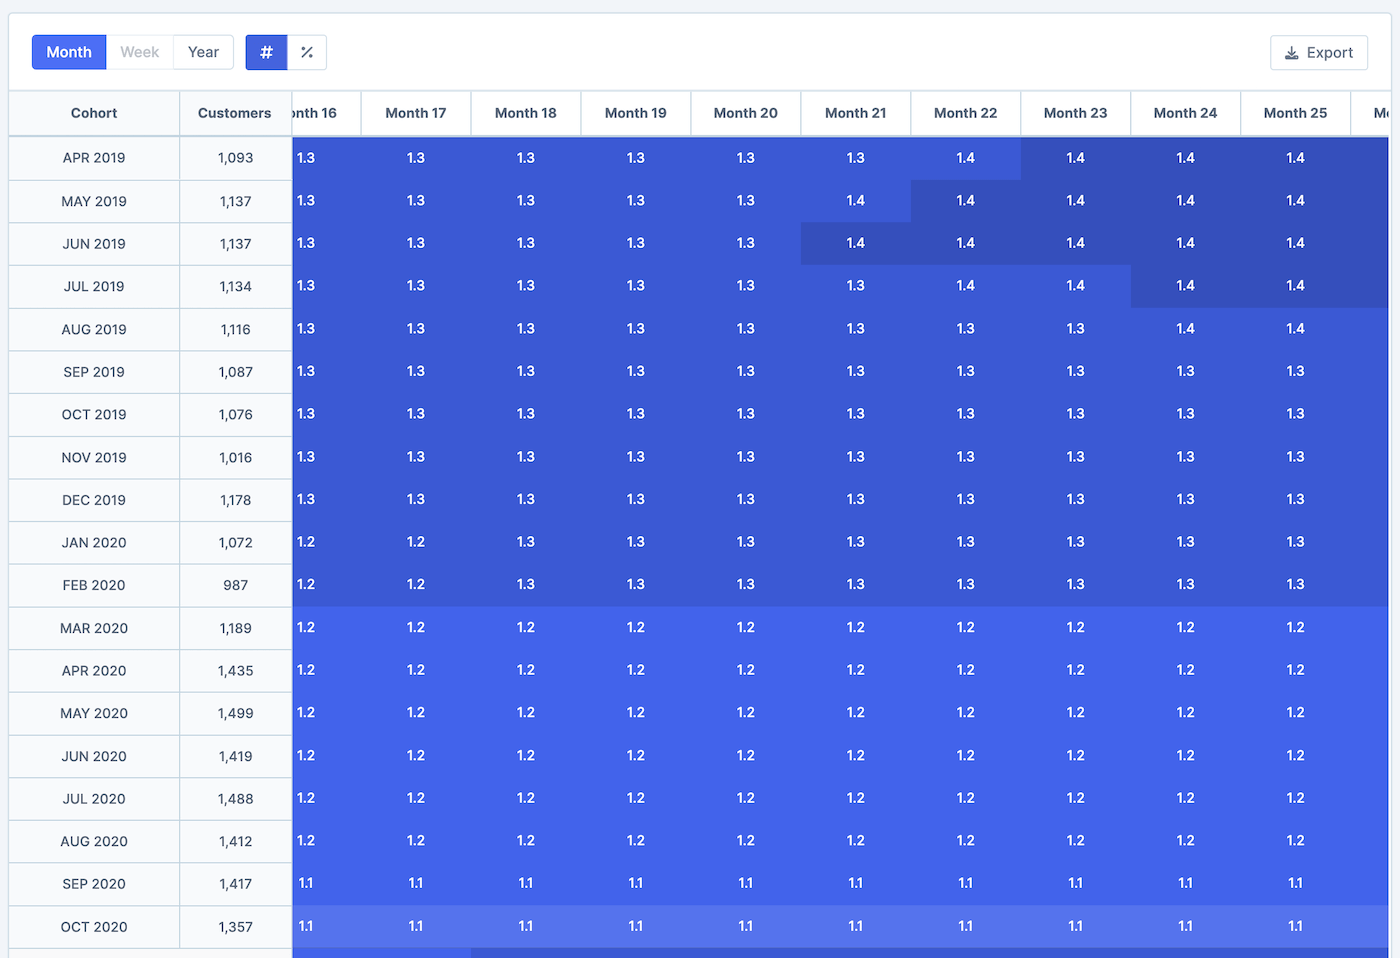
Order per customer
This report shows the average number of orders per customer in each following month after they first ordered.
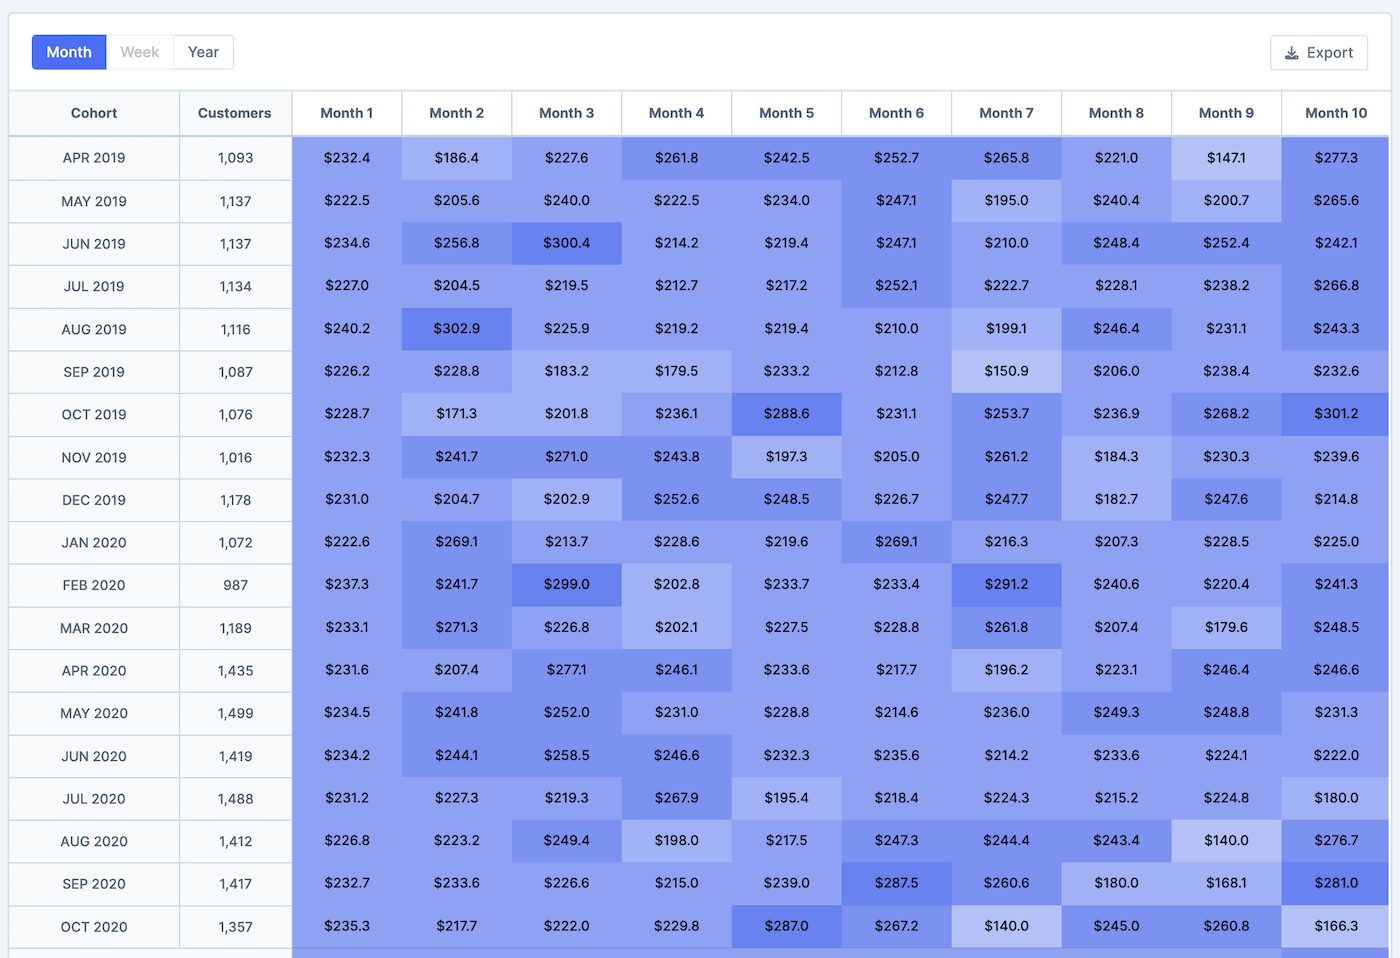
Average order value over time
This report shows the average order value of the orders a cohort has made in each following month after they first ordered.
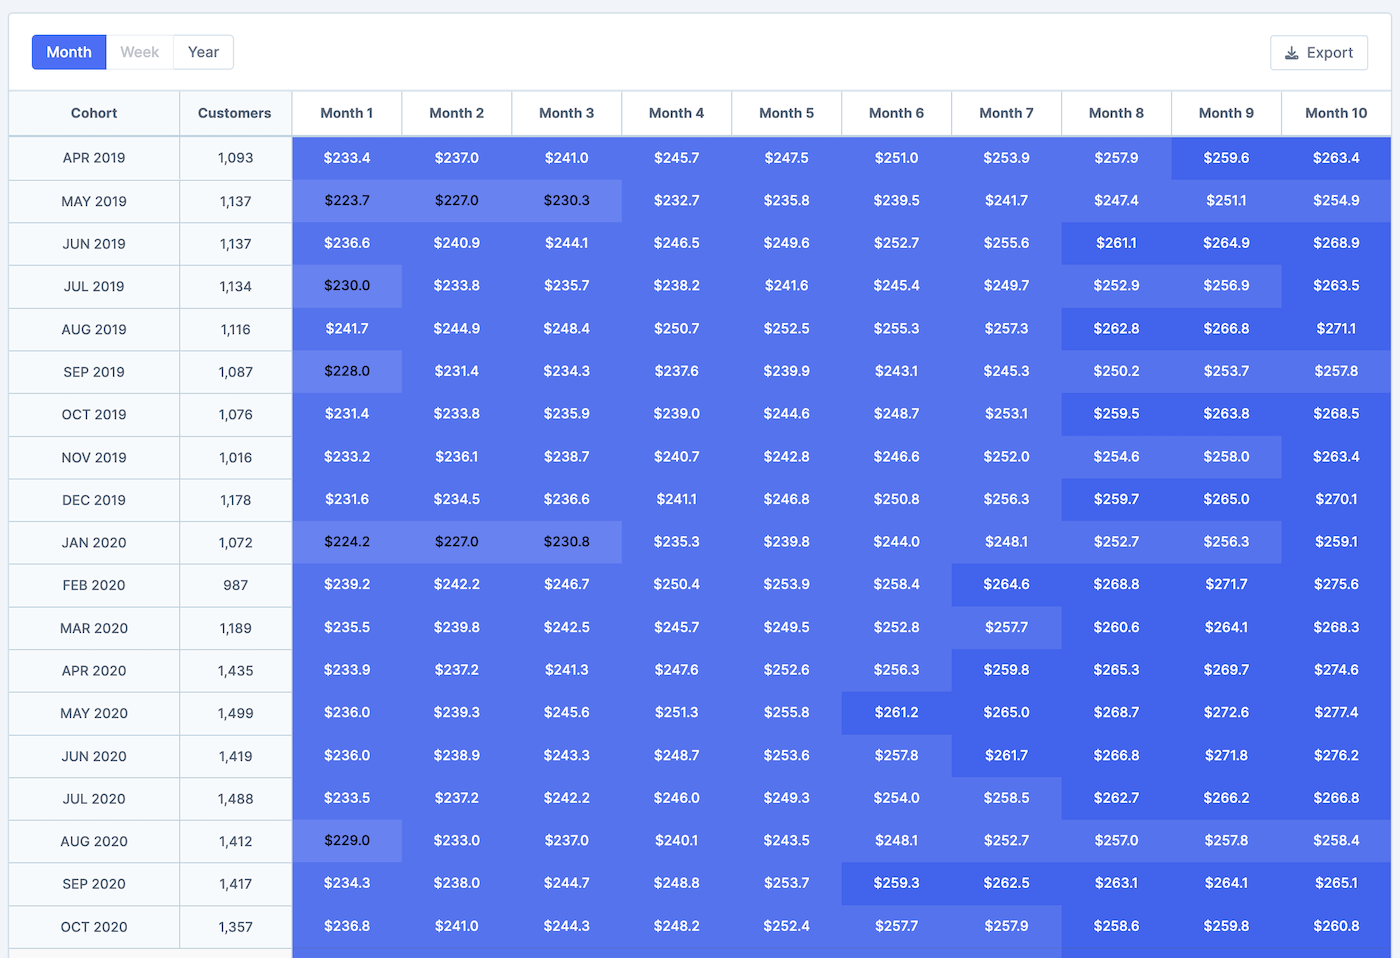
Customer lifetime value over time
This report shows the cumulative average customer lifetime value per cohort in each following month after they first ordered.
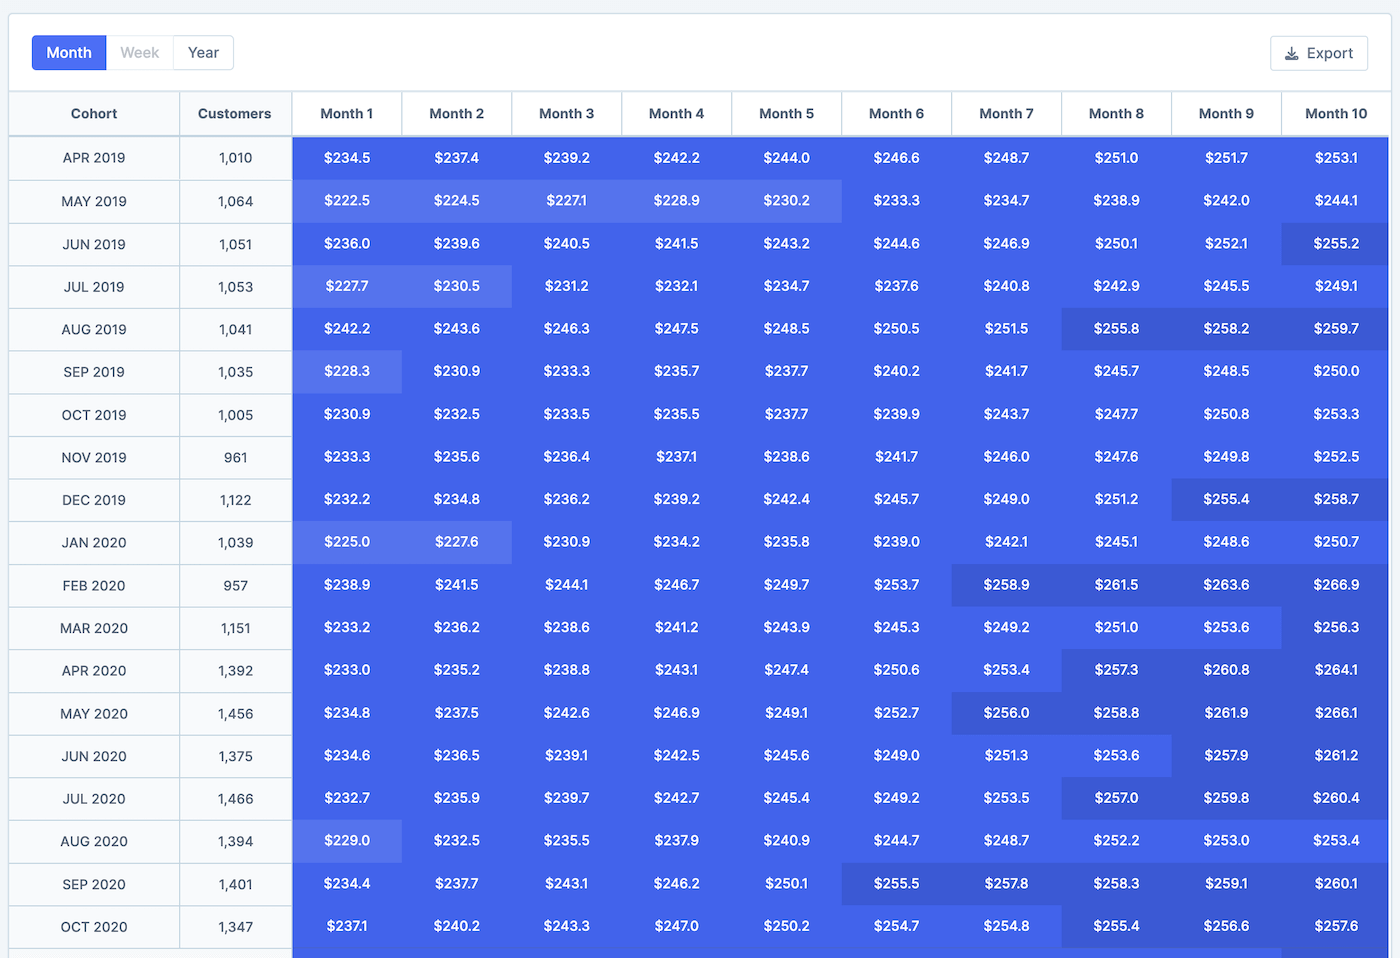
Customer lifetime profit over time
This report shows the average customer lifetime total profit per cohort in each following month after they first ordered.
Note: This will only show if you have cost setup in Metorik.
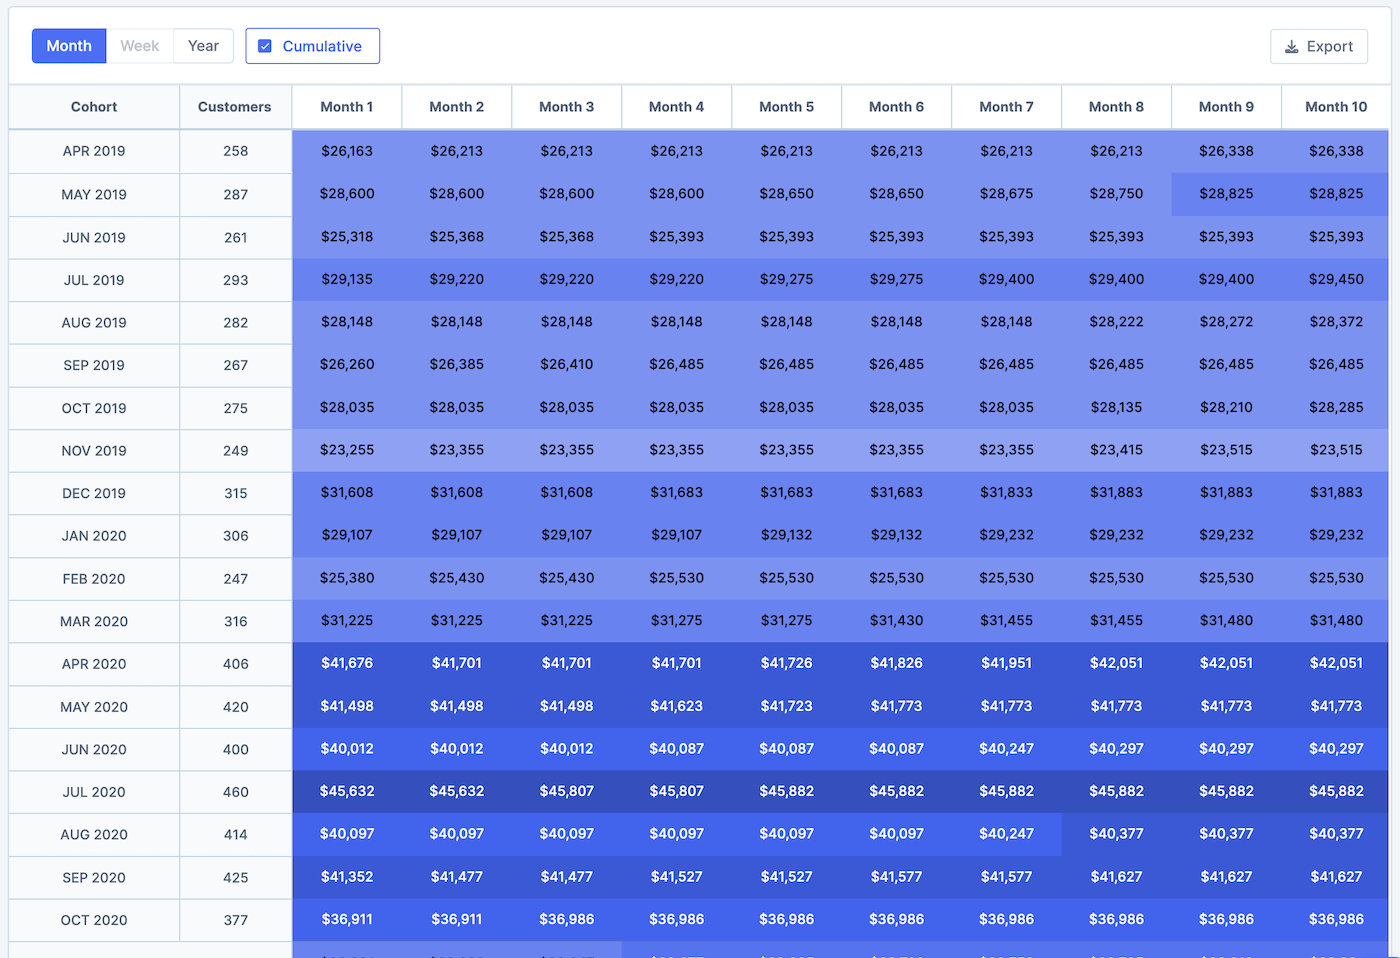
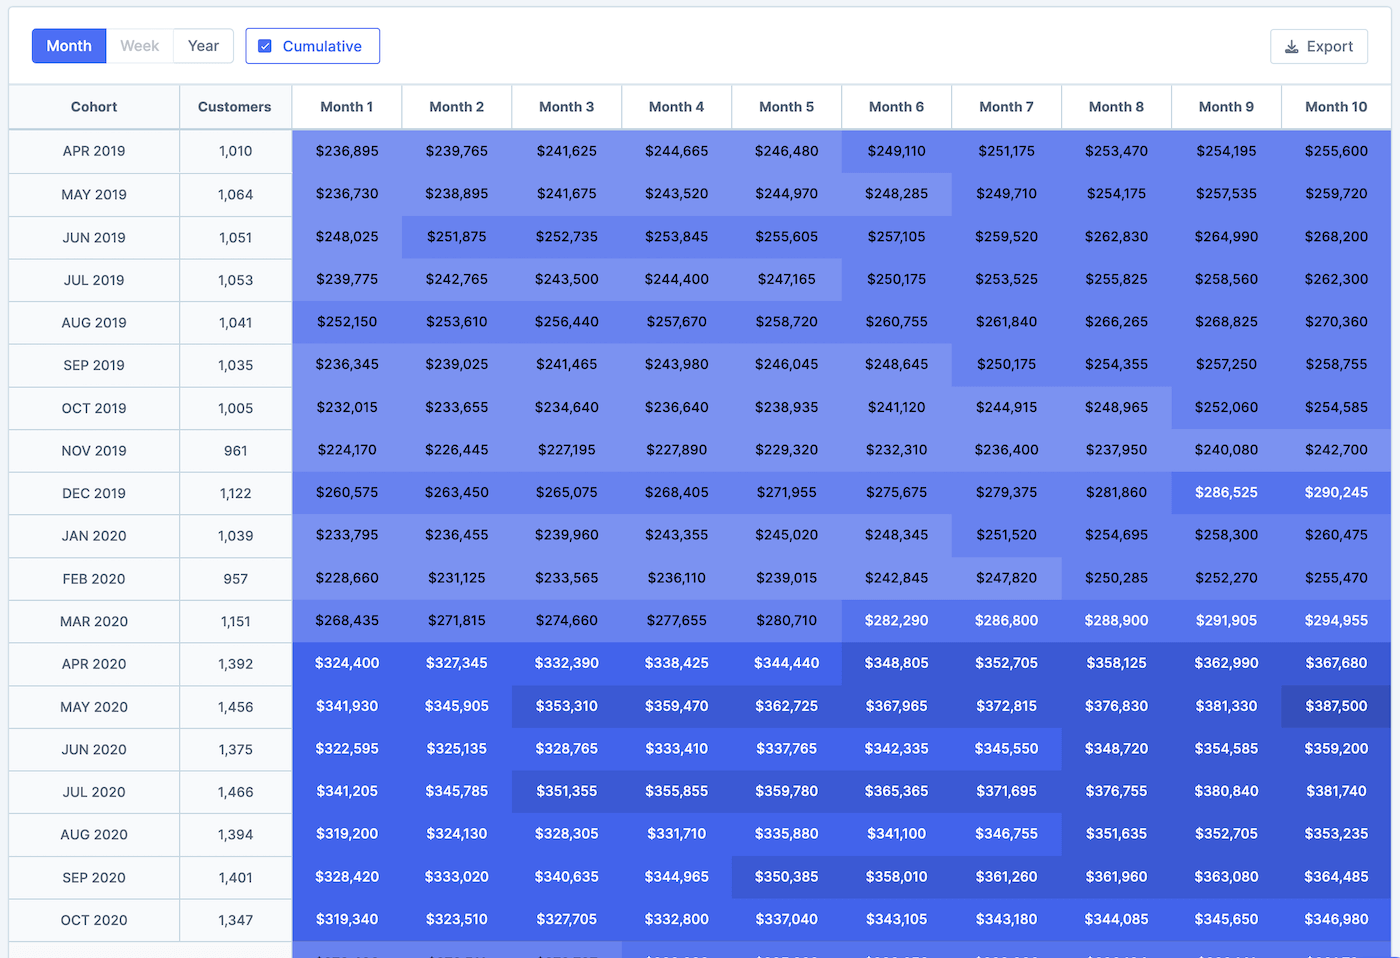
Sales over time
This report shows the total sales (total spent less refunds) per cohort in each following month after they first ordered.
If you check the cumulative checkbox, each cell will include the previous month's data too. So Month 2 = Month 1 + Month 2. Month 3 = Month 1 + Month 2 + Month 3.
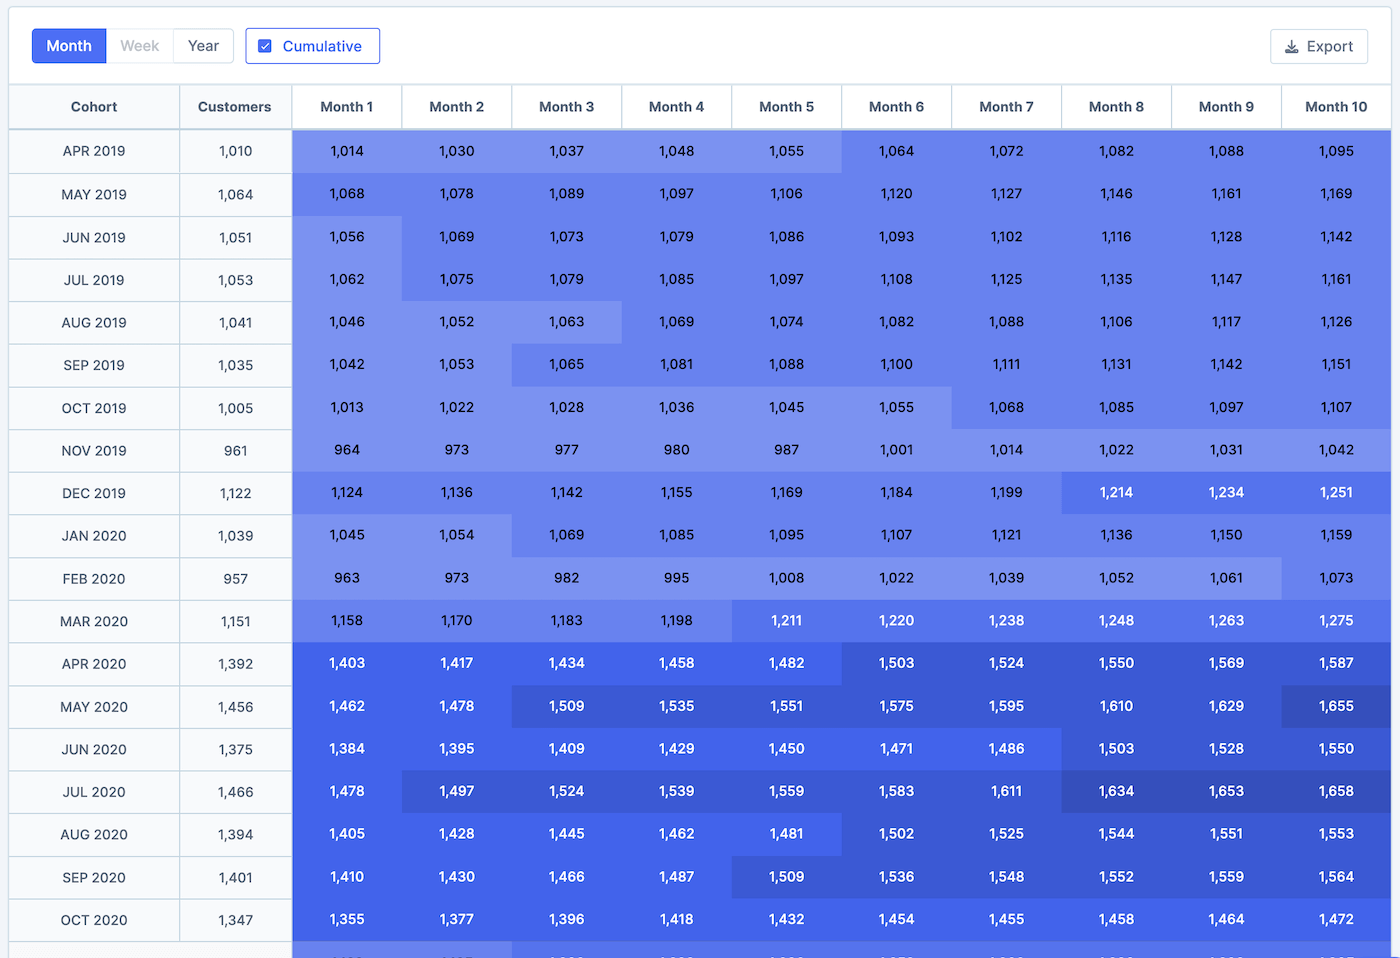
Orders over time
This report shows the number of orders per cohort in each following month after they first ordered.
If you check the cumulative checkbox, each cell will include the previous month's data too. So Month 2 = Month 1 + Month 2. Month 3 = Month 1 + Month 2 + Month 3.
Profit over time
This report shows the total profit per cohort in each following month after they first ordered.
If you check the cumulative checkbox, each cell will include the previous month's data too. So Month 2 = Month 1 + Month 2. Month 3 = Month 1 + Month 2 + Month 3.
Note: This will only show if you have cost setup in Metorik.