
Comparing product and variation performance
Metorik's Compare Products report lets you analyze and compare the sales performance of individual products and variations side by side. You can view revenue and units sold over time, switch between different time groupings, and export the data for further analysis.
How to compare products and variations
Open the Compare Products report
Navigate to Products → Compare Products or go directly to app.metorik.com/reports/compare-products. There's also an identical page for comparing categories at app.metorik.com/compare-categories.
Select the products to compare
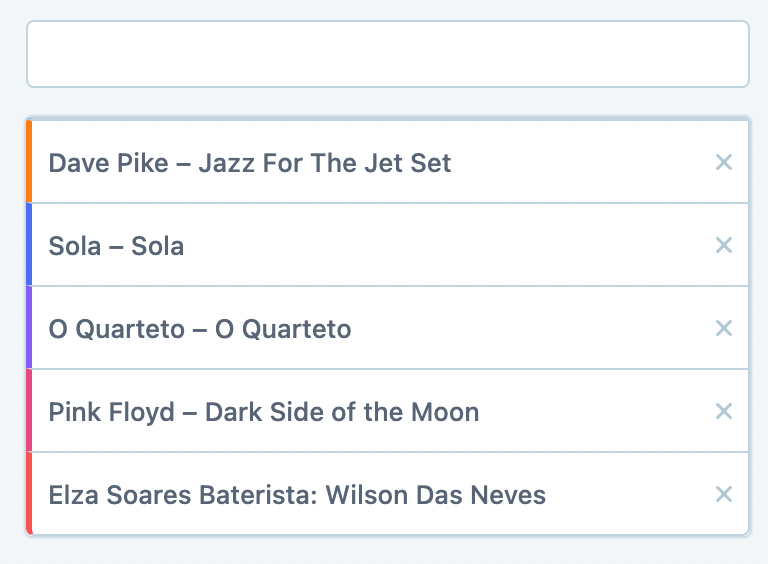
Use the search box at the top of the report to find products. You can search by product name or product ID. Click on each product or variation you want to add to the comparison.
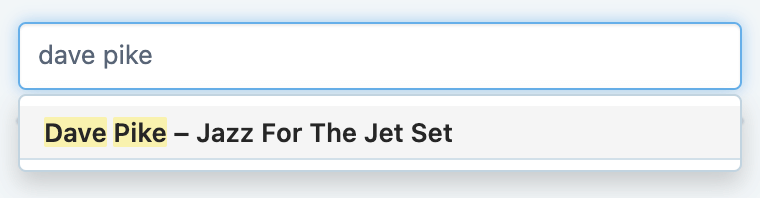
You can add as many products and variations as you need.
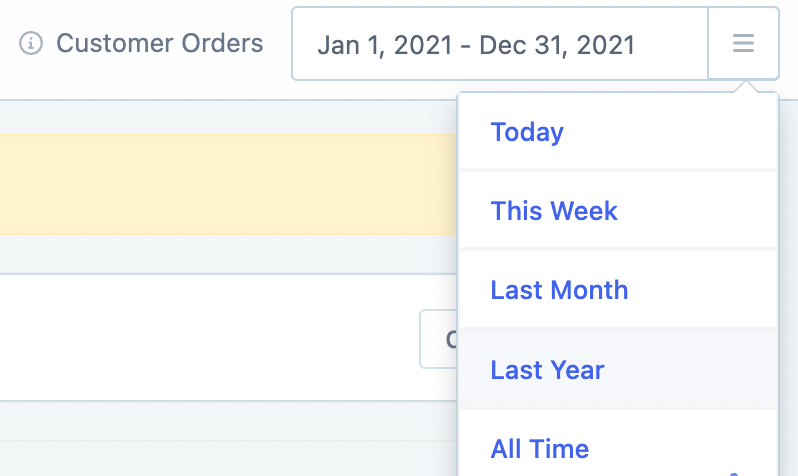
Set the date range
Use the date picker in the top right to select the time period you want to analyze. This controls the data shown in both the graph and the table.
View and analyze the performance data
Metorik displays the performance data in two formats:
Graph: A visual chart showing sales trends over time
Table: Detailed numbers broken down by period
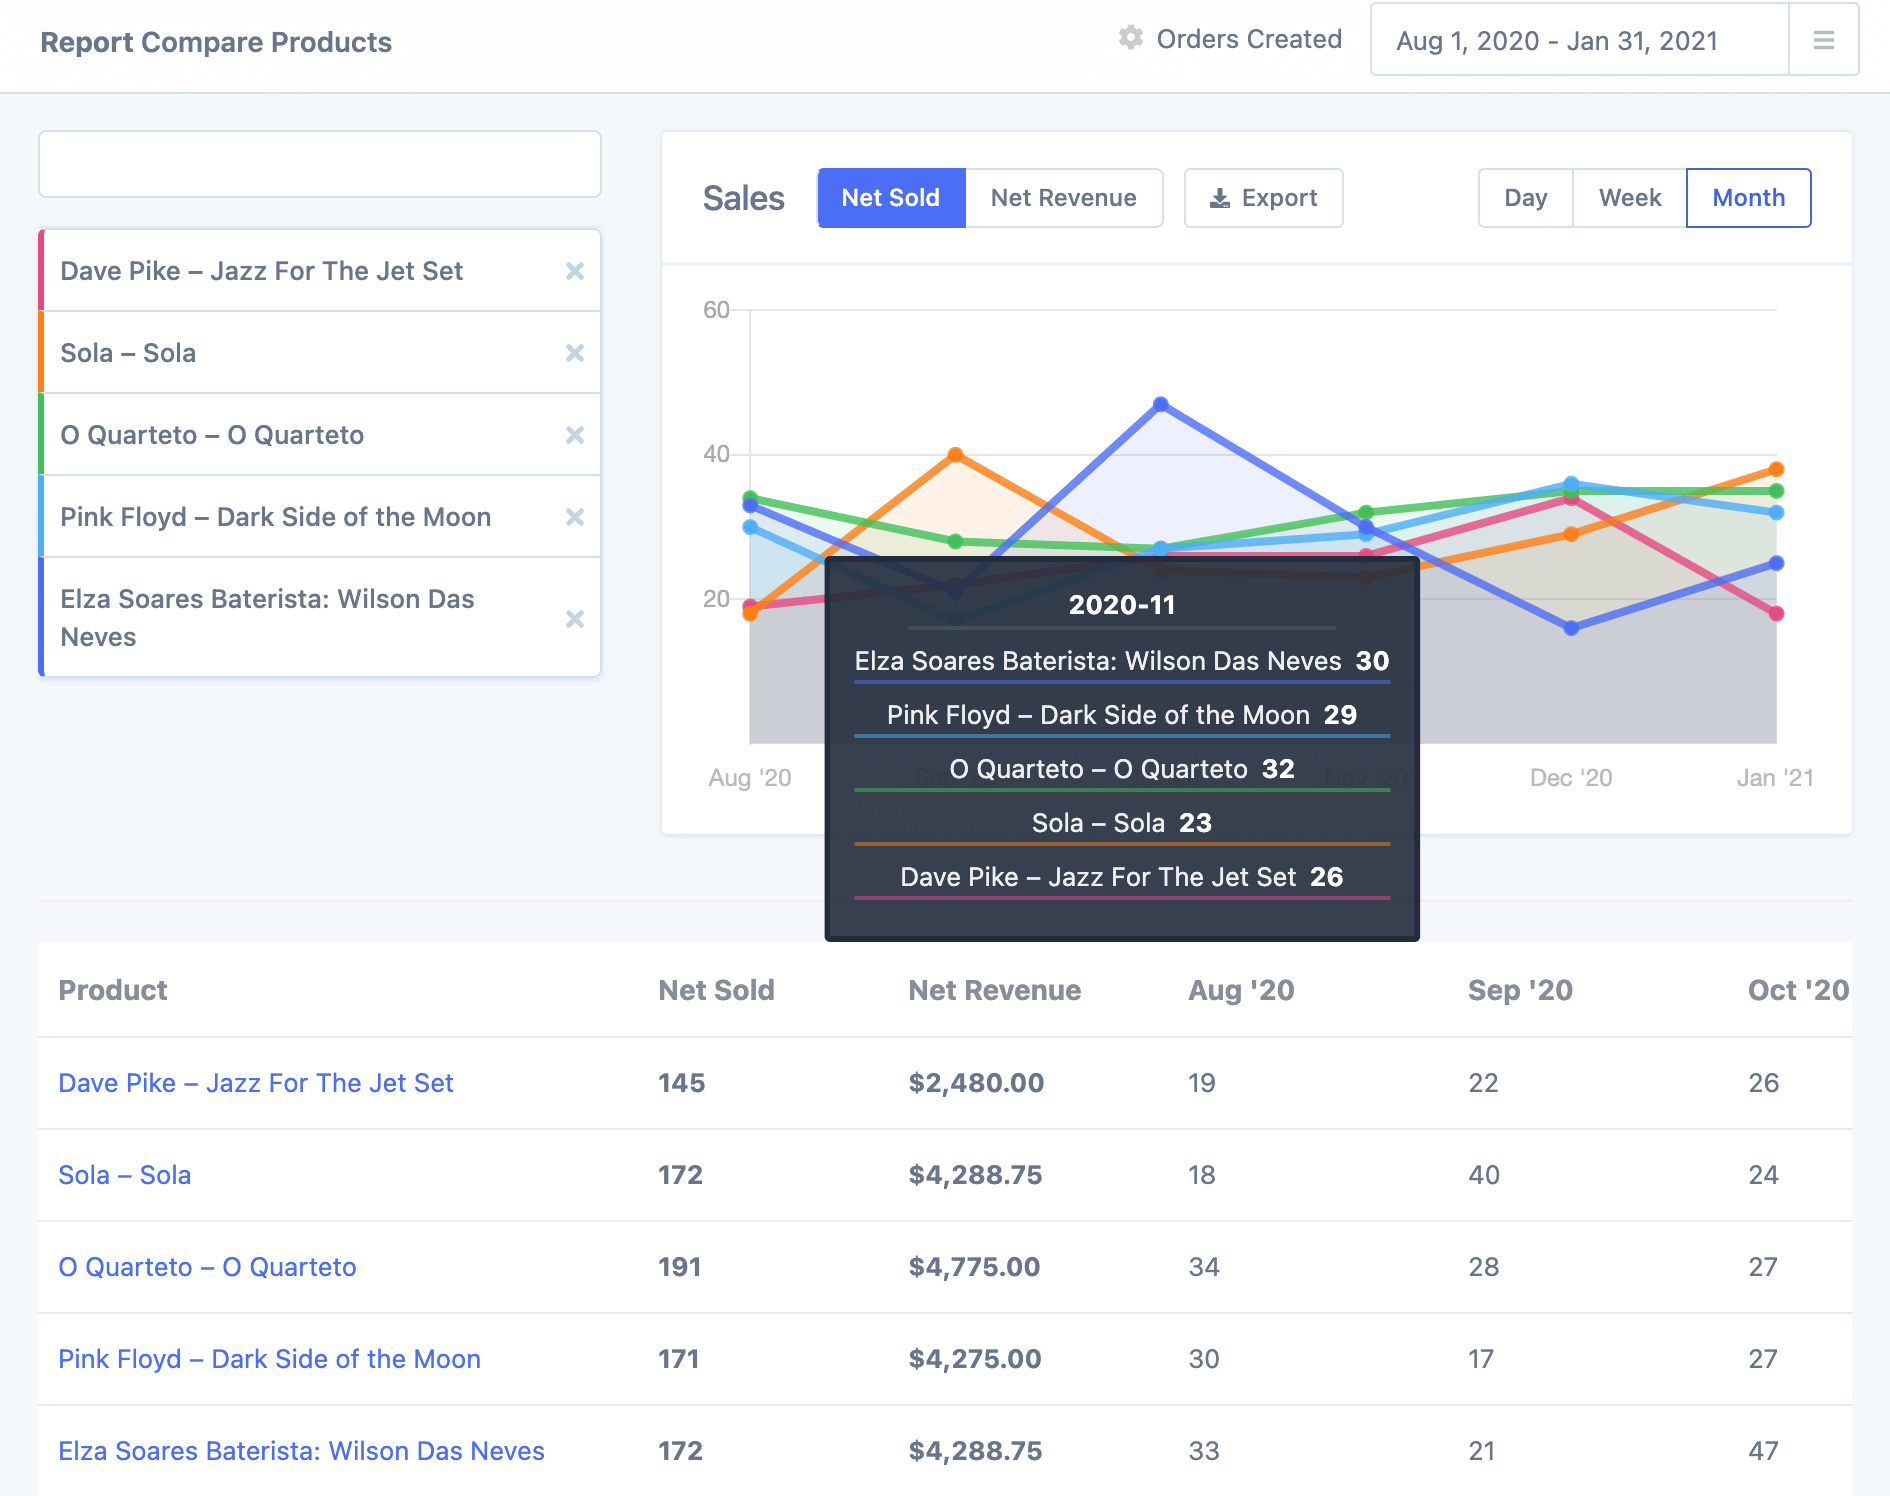
Hover over any data point on the graph to see the specific sales for that period across all selected products.
Adjust the graph options
Customize what data you see in the graph:
Net Sold vs. Net Revenue: Toggle between viewing units sold or revenue amounts
Day/Week/Month: Change how the data is grouped on the timeline

Export the comparison data
Click the Export button to download your comparison data as a CSV file. This lets you share the analysis with your team or use it in spreadsheets and presentations. Learn more about exporting data from Metorik.
Understanding variations and variants
Metorik uses different terminology depending on your platform:
WooCommerce: Product variations
Shopify: Product variants
Both refer to the different versions of a product (such as size, color, or material options). The Compare Products report works the same way for both platforms—you can mix products and their individual variations in the same comparison.
Next steps
Explore all product reports available in Metorik
Learn about segmenting data to filter product sales by customer, geography, or other attributes
Set up product stock management alerts