
Seeing refunds broken down by reason
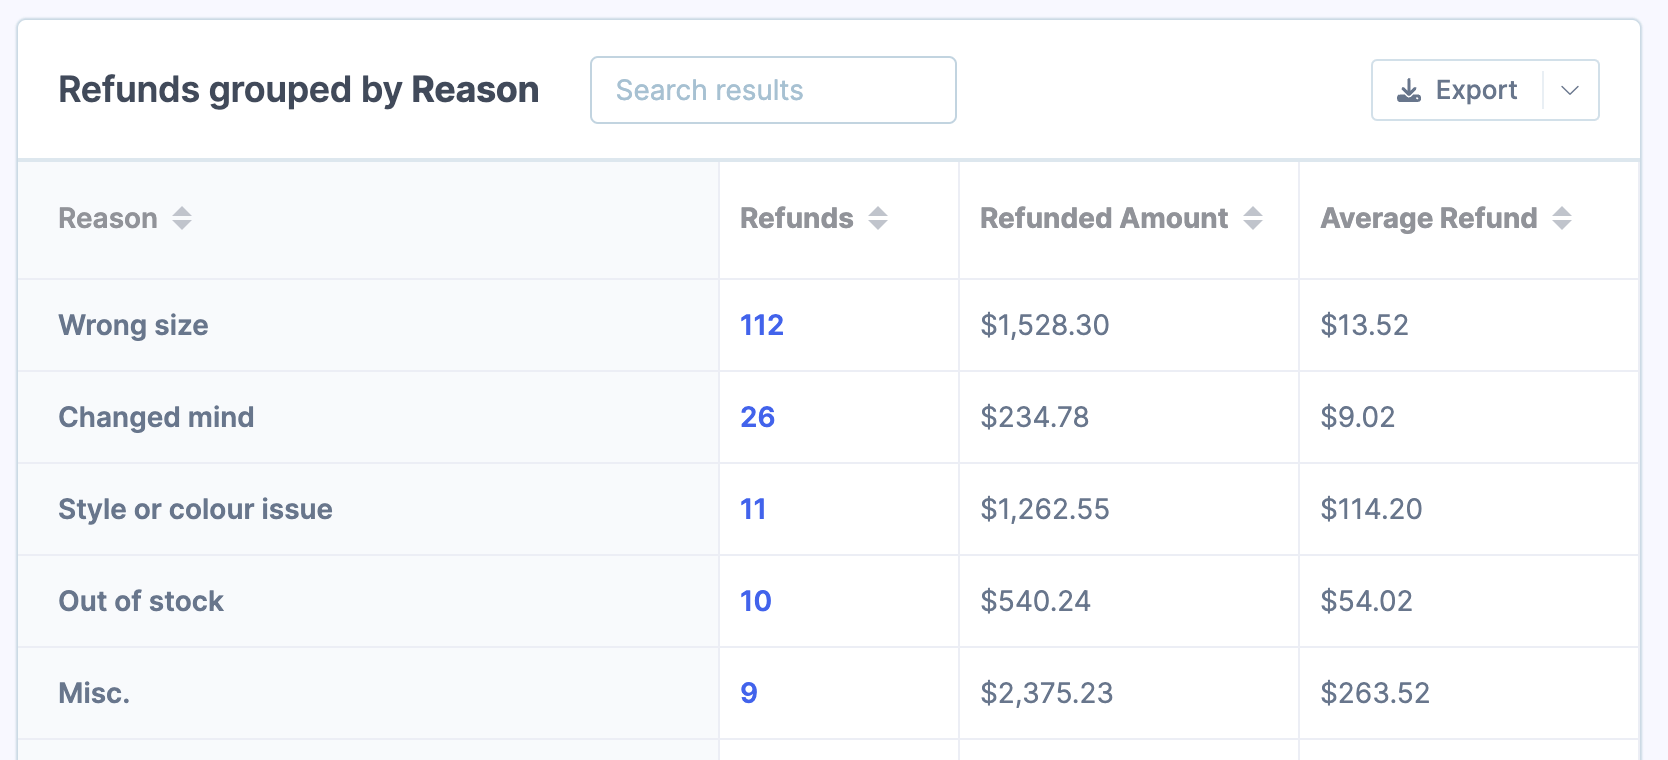
Metorik's refunds report lets you analyze refunds grouped by reason, showing you how many refunds occurred for each reason, the total amount refunded, and the average refund amount. This helps you identify the most common reasons customers request refunds and their financial impact on your store.
Analyzing refunds by reason
Follow these steps to view your refunds broken down by reason:
Go to the Refunds Report
Navigate to the Refunds Report in your Metorik dashboard.
Switch to the refunds grouped by reason view
In the report, switch the grouping dropdown to Reason. This displays a table showing each refund reason with the count, total amount refunded, and average refund amount.
Review your refund data
The table shows three key metrics for each refund reason:
Refunds — The number of refunds with that reason
Refunded Amount — The total dollar amount refunded for that reason
Average Refund — The average refund amount per transaction for that reason
You can click any column header to sort the data, making it easy to identify your most common refund reasons or the reasons with the highest financial impact.
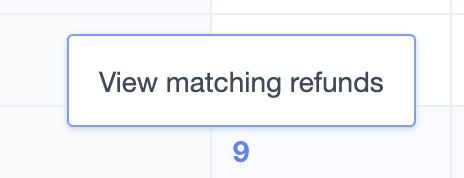
Drill into specific refunds
Click the refund count for any reason to view all matching refunds. This opens the refunds segmenting page filtered to that specific reason, allowing you to inspect individual refund details.
Export the data
Click the Export button at the top of the report to download the grouped data as a CSV file. This is useful if you have many refund reasons and want to analyze the data in a spreadsheet or share it with your team.
For more export options, see Exporting Data.
Add to your dashboard (optional)
You can add the refunds grouped by reason report as a card on your custom dashboard for quick access. See Customising the Dashboard to learn how to add new report cards.
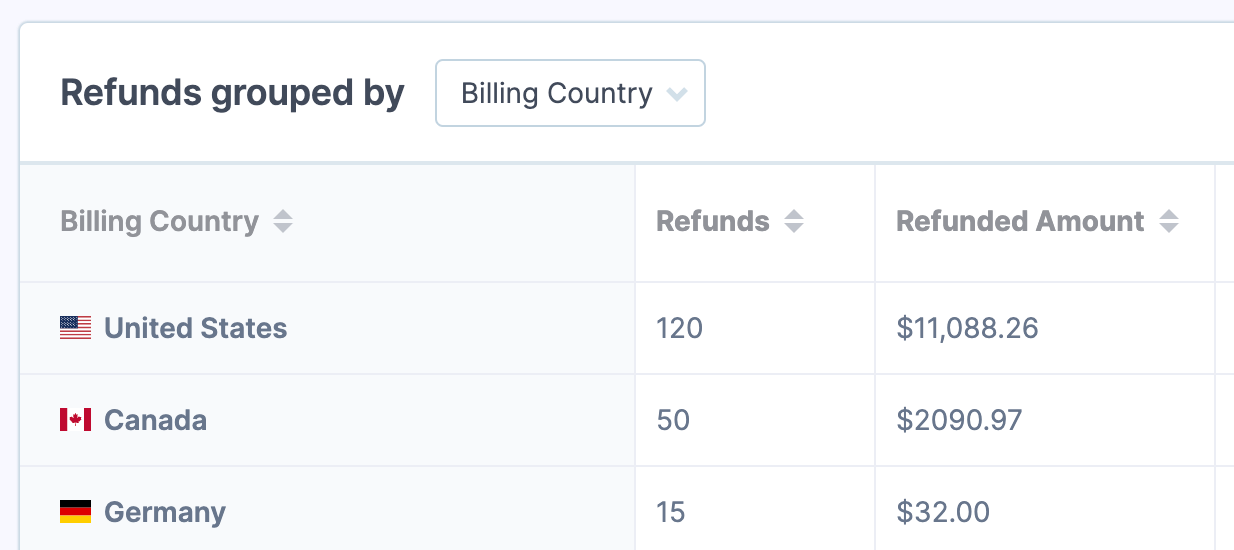
Other grouping options
Beyond reason, the refunds report offers additional groupings to analyze your refunds from different angles:
Billing Country — See which countries generate the most refunds
State — Identify refund patterns by state or region
City — Drill down to city-level refund data
Shipping fields — Analyze refunds by shipping destination
Segmenting the report
Like all reports in Metorik, you can segment the refunds report to focus on specific subsets of data. Add filters to view refunds for certain products, locations, payment methods, or any combination of criteria.
For more information on using segments, see Segmenting Data.
For broader context on how refunds appear across different reports in Metorik, see Refunds in Metorik.