
Finding your best selling days, weeks, or months
Use the Revenue Report to identify your highest and lowest performing days, weeks, or months. This data can help you plan promotions, optimize staff scheduling, and time your marketing campaigns.
Go to the Revenue Report
Navigate to the Revenue Report in Metorik. This report shows your revenue trends over time with gross revenue, net revenue, and day-by-day breakdowns.
Set the date range
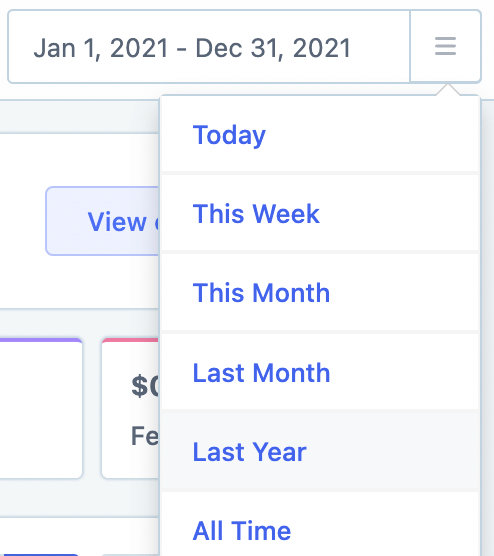
Click the date picker in the top right and select Last Year to see a full year of data. You can also choose any custom date range that makes sense for your analysis.
Go to Revenue Breakdown
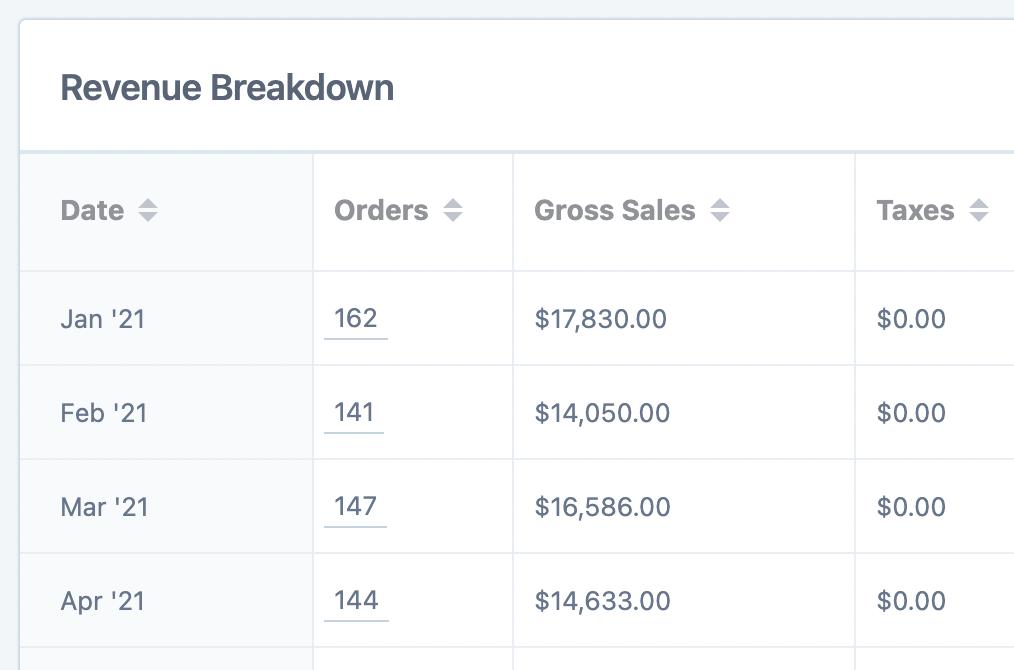
Scroll down to the Revenue Breakdown section. By default, this table shows your revenue data grouped by month.
Switch to daily grouping
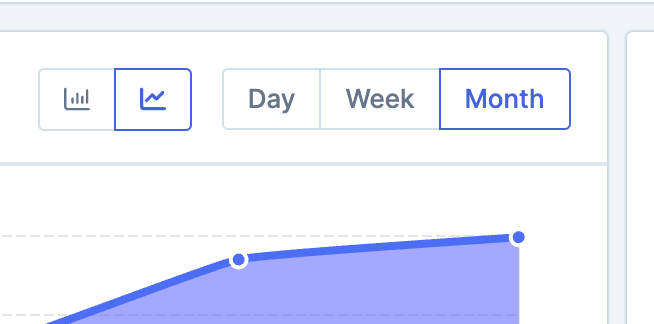
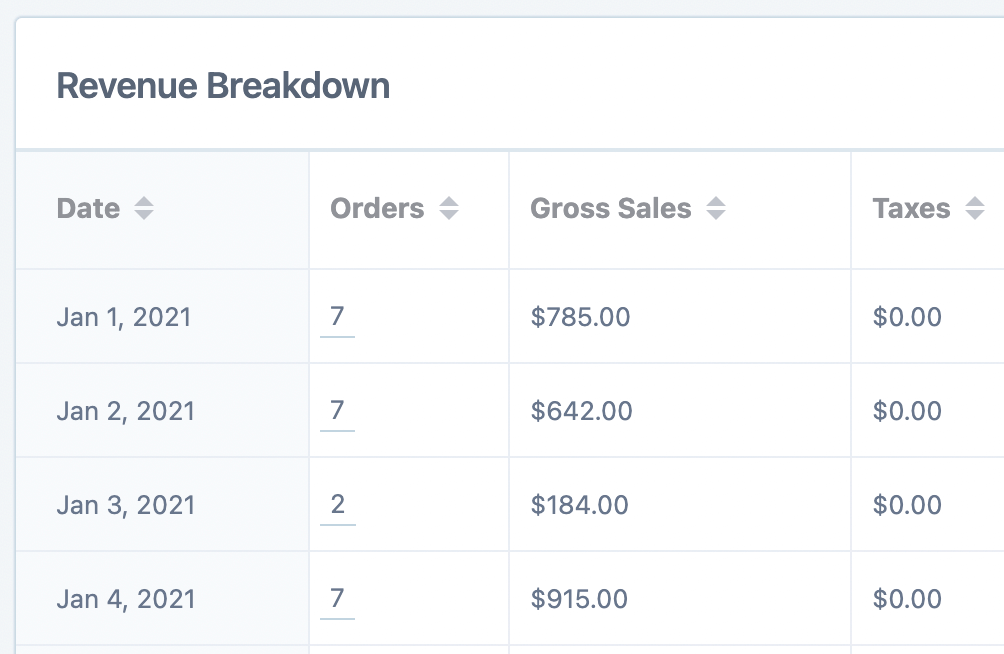
On the right side of the table, click the Day button to see your revenue broken down by individual days.

You can also choose Week or Month if you prefer to analyze your best performing weeks or months instead.
Sort by order count
Click the Orders column header to sort the table by order count, showing your best performing days at the top.
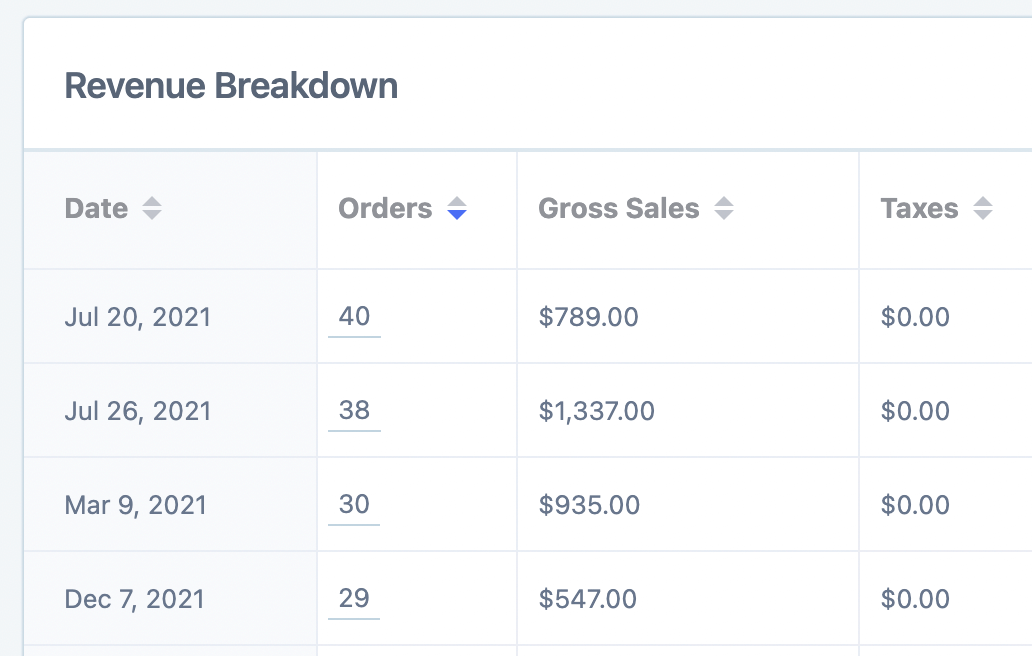
Click the Orders header again to reverse the sort and see your lowest performing days at the top.
Export for further analysis (optional)
Click the Export button to download the data as a CSV file for further analysis in a spreadsheet. Learn more about Exporting Data.
What to do with this data
Once you know your best and worst selling days, you can:
Run promotions on slower days to boost sales
Launch major campaigns on your strongest days for maximum impact
Adjust staffing levels based on expected order volume
Plan inventory and shipping resources around peak periods
Using this data for email marketing
You can use these insights to time your marketing campaigns strategically. Metorik Engage lets you send automated emails, broadcasts, and abandoned cart campaigns based on customer behavior and purchase patterns.
For example, you might schedule promotional broadcasts to go out on days that historically drive strong sales, or set up automated campaigns that trigger during typically slower periods.
Looking for more report insights? See Your first report for a tour of Metorik's core reports, or learn about Reports Segmenting to filter by customer type, product, or any other attribute.