
Using the Revenue Report
The Revenue Report gives you a complete view of your store's revenue performance over time. Track gross revenue, net revenue, refunds, and other key metrics with flexible date ranges, visual graphs, and detailed breakdowns.
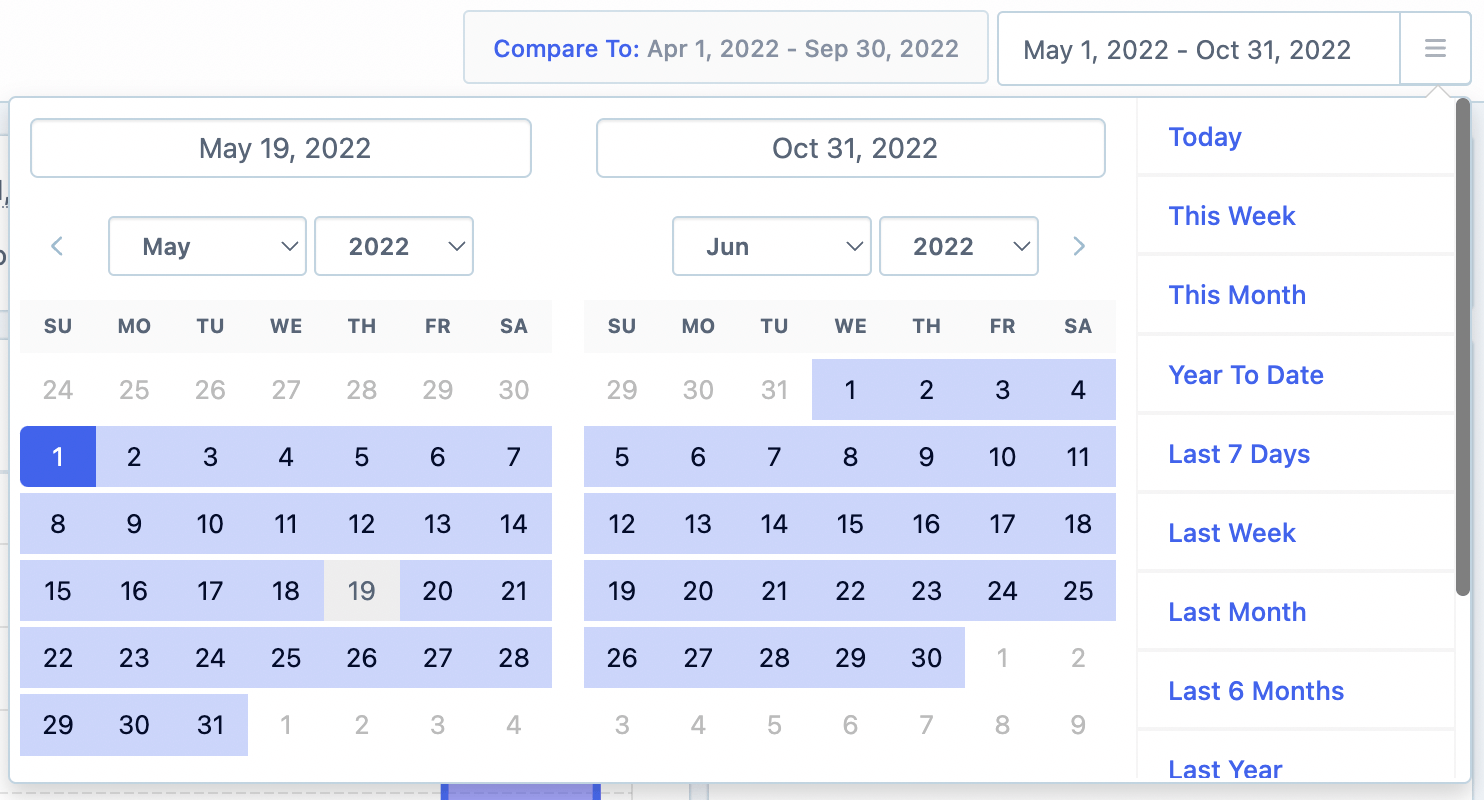
Set the date range
Open the Revenue Report and select the date range you want to analyze — such as the current year, last month, or a custom period.
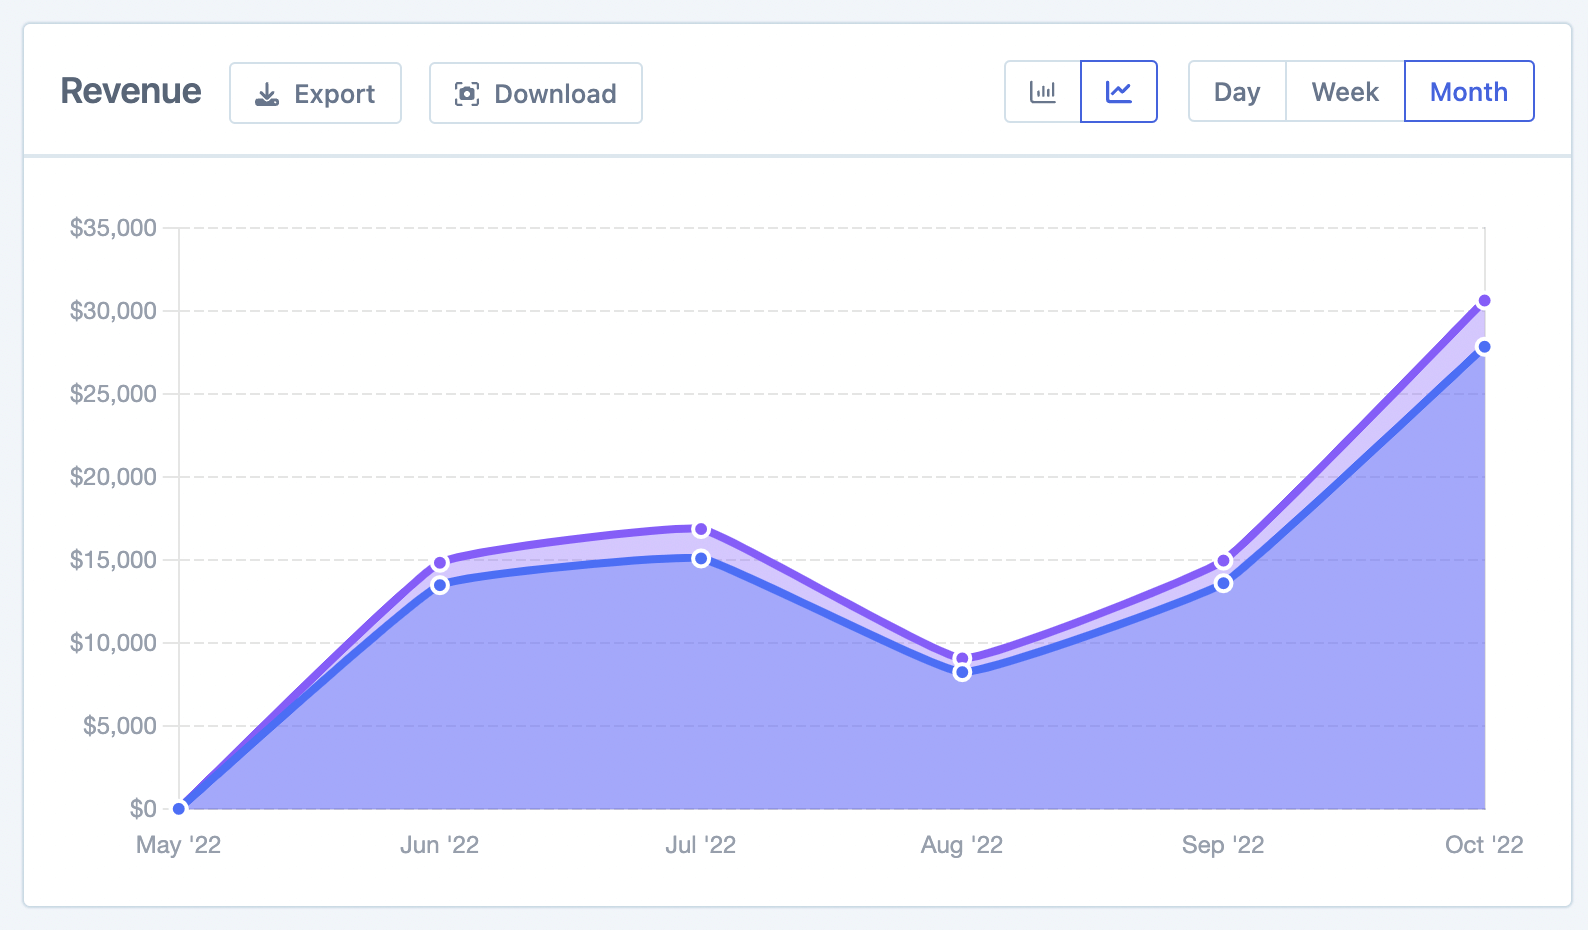
View the revenue graph
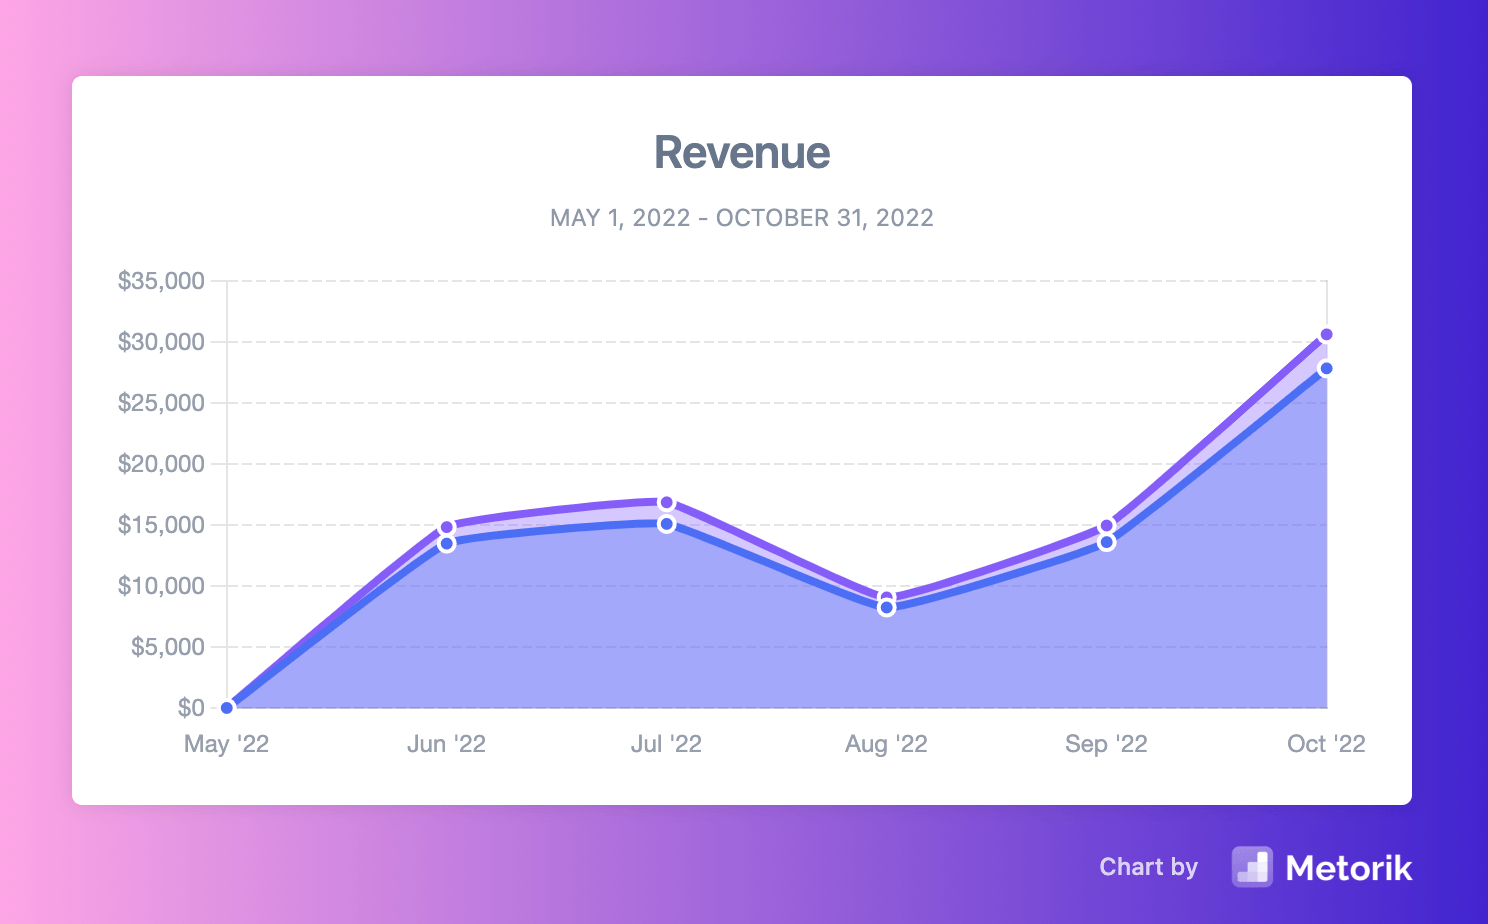
The graph shows your revenue trends for the selected period. You can customize the display:
Group by: Day, week, or month
Display format: Switch between bar graph and line graph
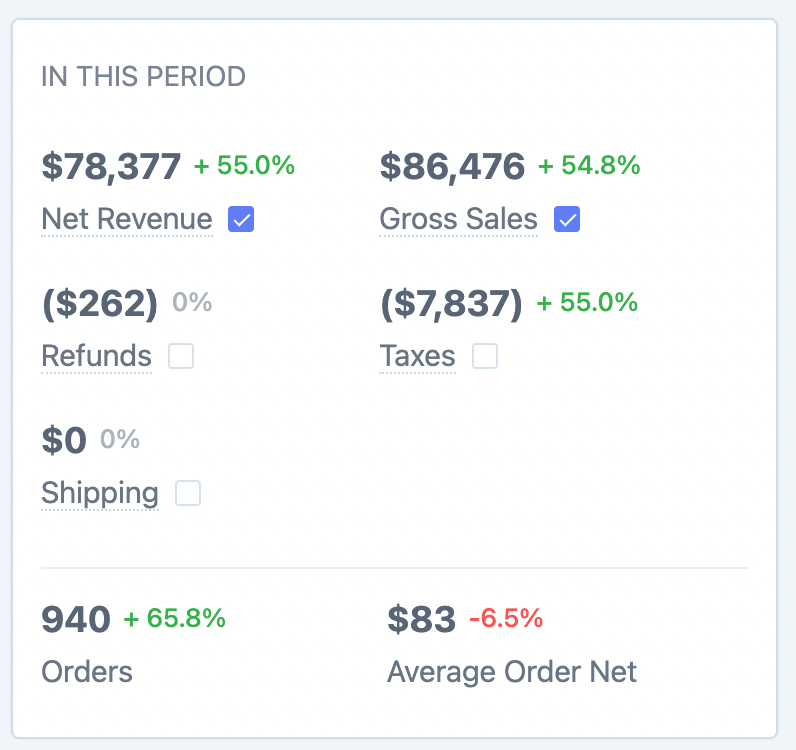
Review overall total stats
Below the graph, you'll see overall totals for the period including gross revenue, net revenue, refunds, orders, and more.
Select the checkbox next to any statistic to include it in the graph visualization. This lets you compare multiple metrics at once.
Compare with previous periods
Each stat shows a percentage value. Hover over it to see the "Previously" comparison value.
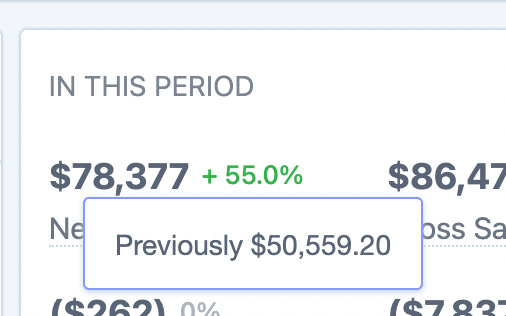
This feature uses the "Compare period" functionality, which contrasts your current data with earlier time periods to identify growth trends. Learn more in the Compare Periods guide.
Understand the refunds value
The refunds value shows refunds made during this period — not refunds tied to orders placed during this period. This is different from how the Orders Report handles refunds. For a detailed explanation, see Net Revenue and the Orders Report.
For example, if a customer orders in January and requests a refund in March, the Revenue Report for March will include that refund, while the Orders Report for January will show it against the original order date.
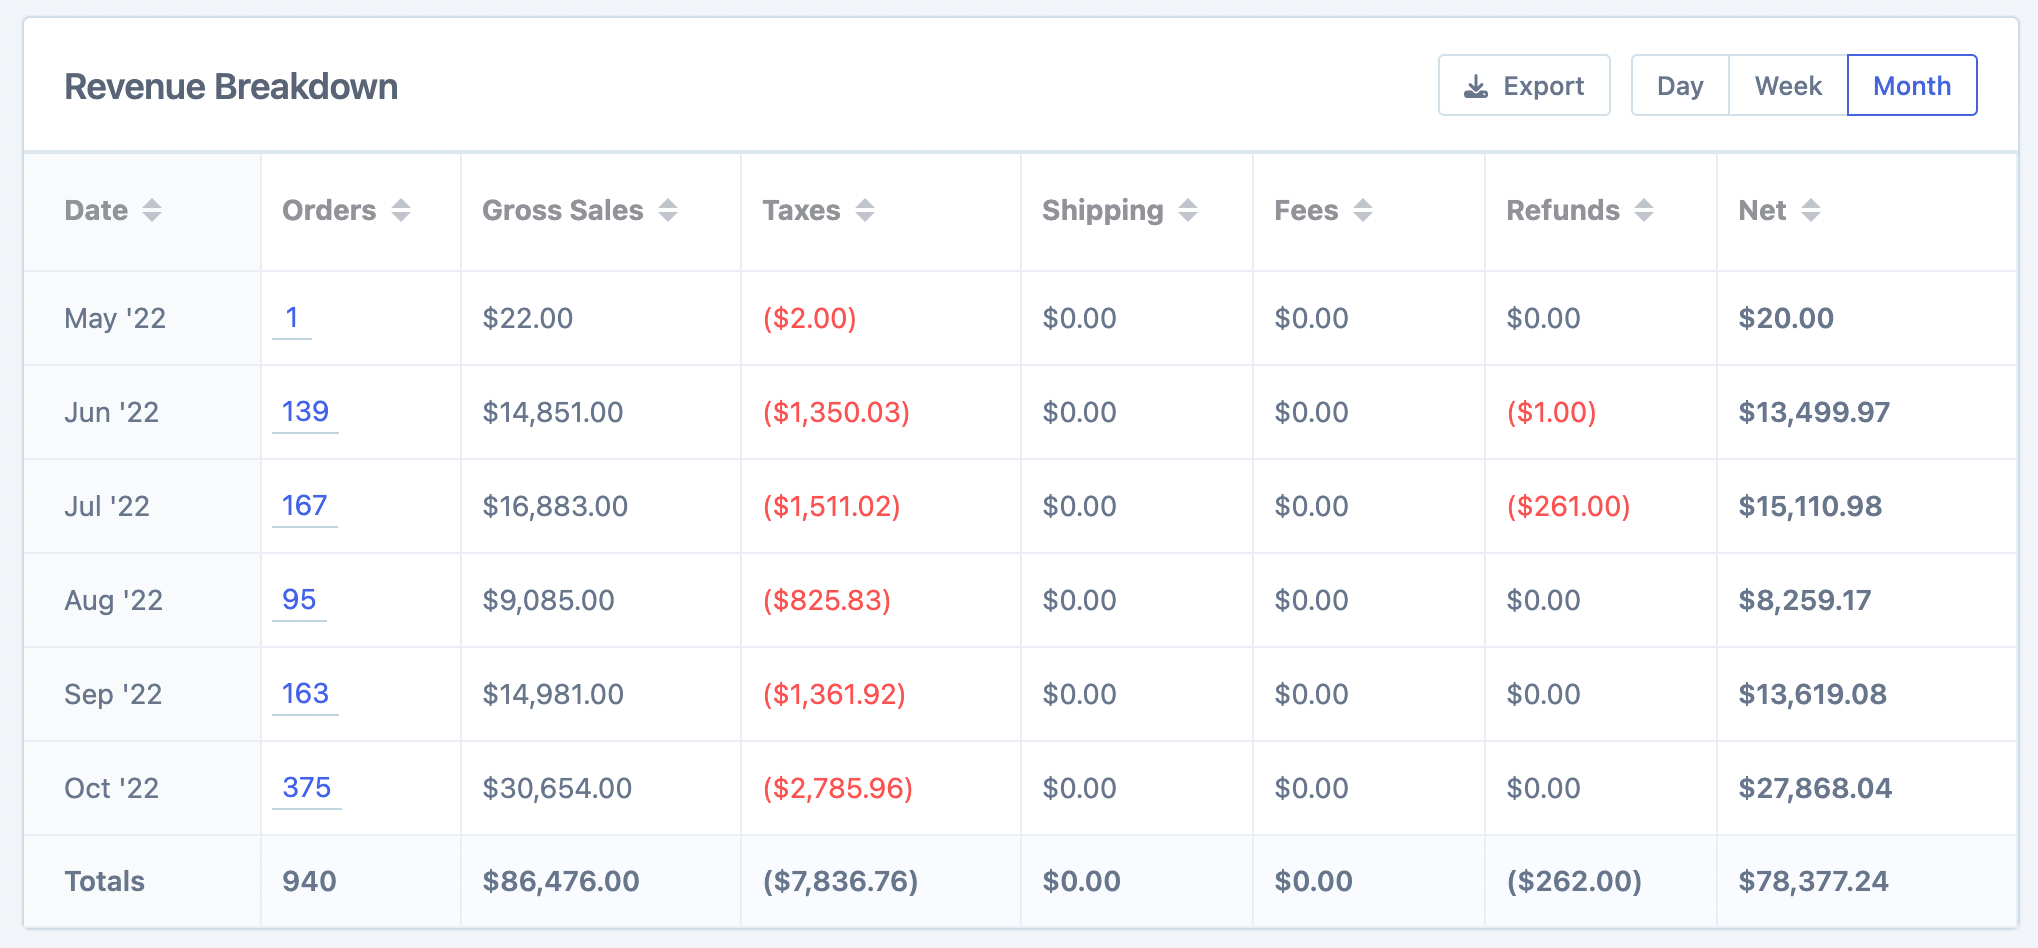
Explore the breakdown table
Scroll down to see a detailed breakdown table of your revenue statistics. Like the graph, you can display this by day, week, or month.
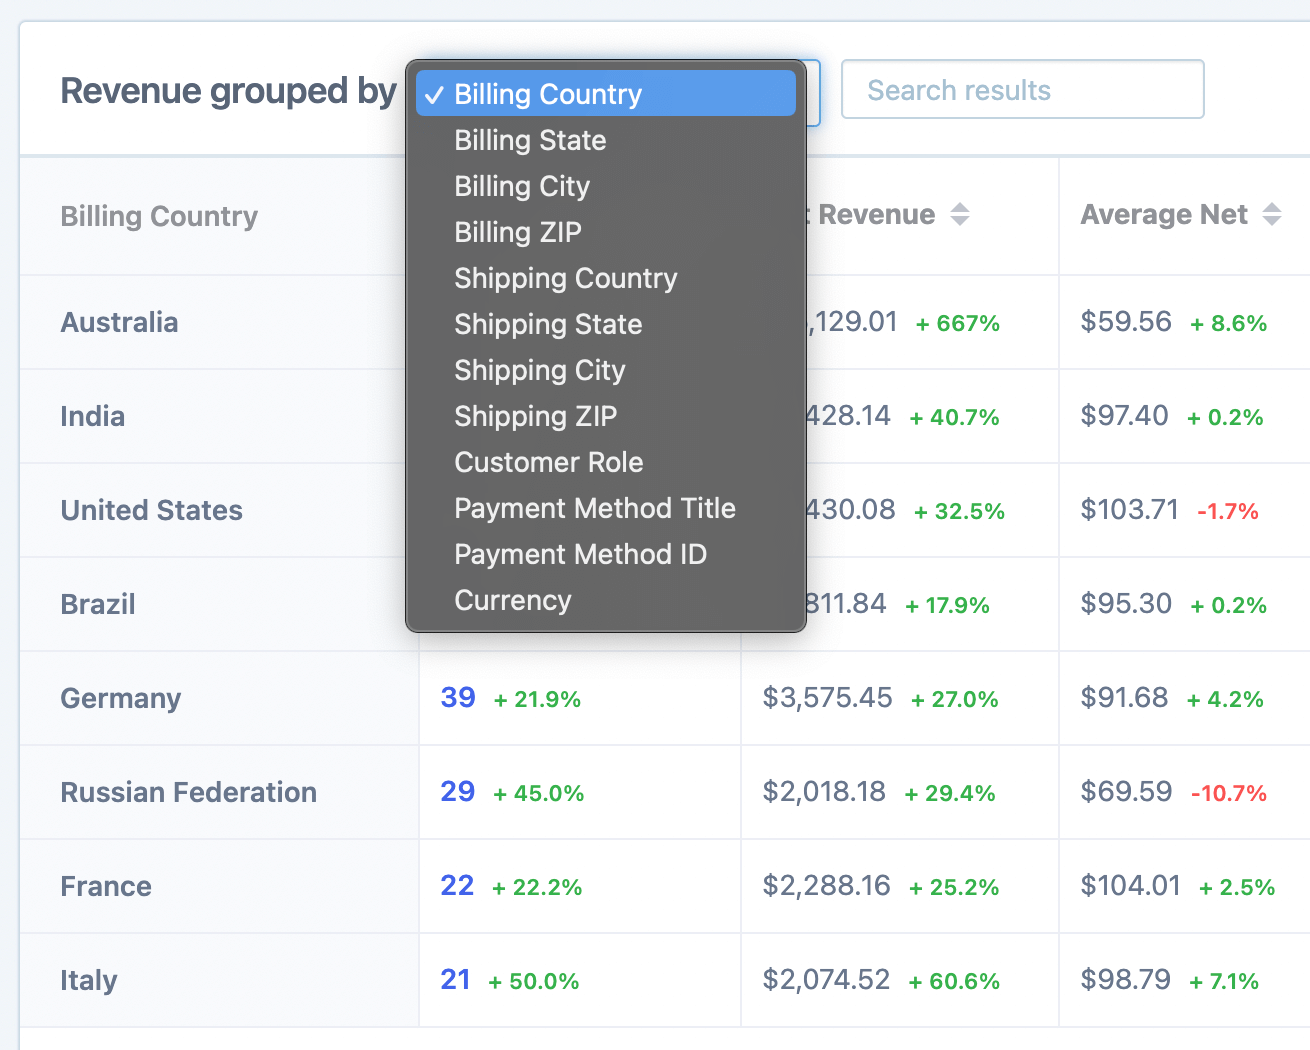
Group by different criteria
Use the grouping options to drill down into specific revenue segments:
Billing country — See revenue by customer location
Customer role — Compare wholesale vs retail customers
Payment method — Track revenue by payment type
Tax rate code/ID — View revenue grouped by tax rates
For detailed tax reporting by rate code, see the Tax Reports guide.
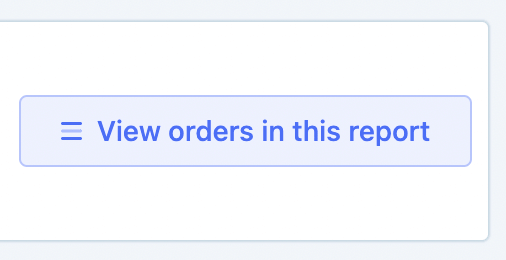
View the orders behind the numbers
Click the View orders in this report button to see all orders contributing to the report totals.
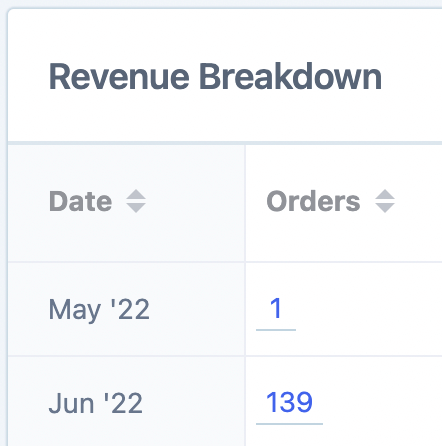
You can also click directly on order counts in the breakdown table to jump to the Orders page with date filters already applied.
Export your data
Each section has an Export button that downloads a CSV file with all the data for external analysis.
For the graph, use the Download button to save the chart as an image for presentations or reports.
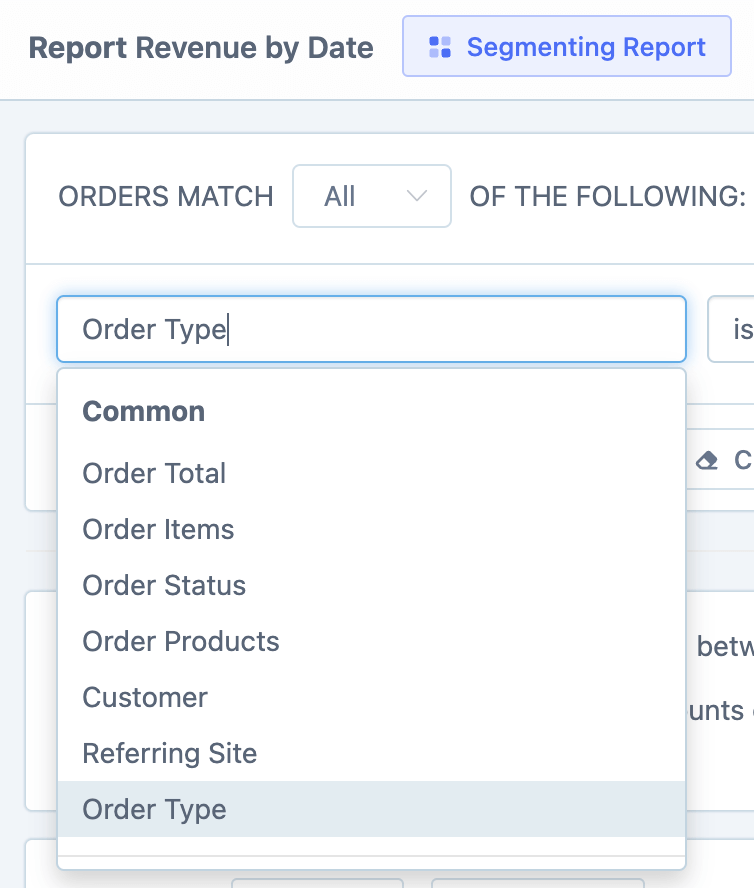
Segment the report
Use the Segmenting Tool to filter the Revenue Report by hundreds of different criteria — from customer segments and product categories to geographic regions and marketing channels.
Learn more about building powerful segments in the Segmenting Data guide.