Track goals in Metorik
Goals let you set targets for any metric or segment total and track your progress over time. You can create one-off goals for specific events or recurring goals that automatically update each period. Add goal cards to your dashboard to see progress at a glance.
Create a goal
From the sidebar, go to Analyze > Goals.
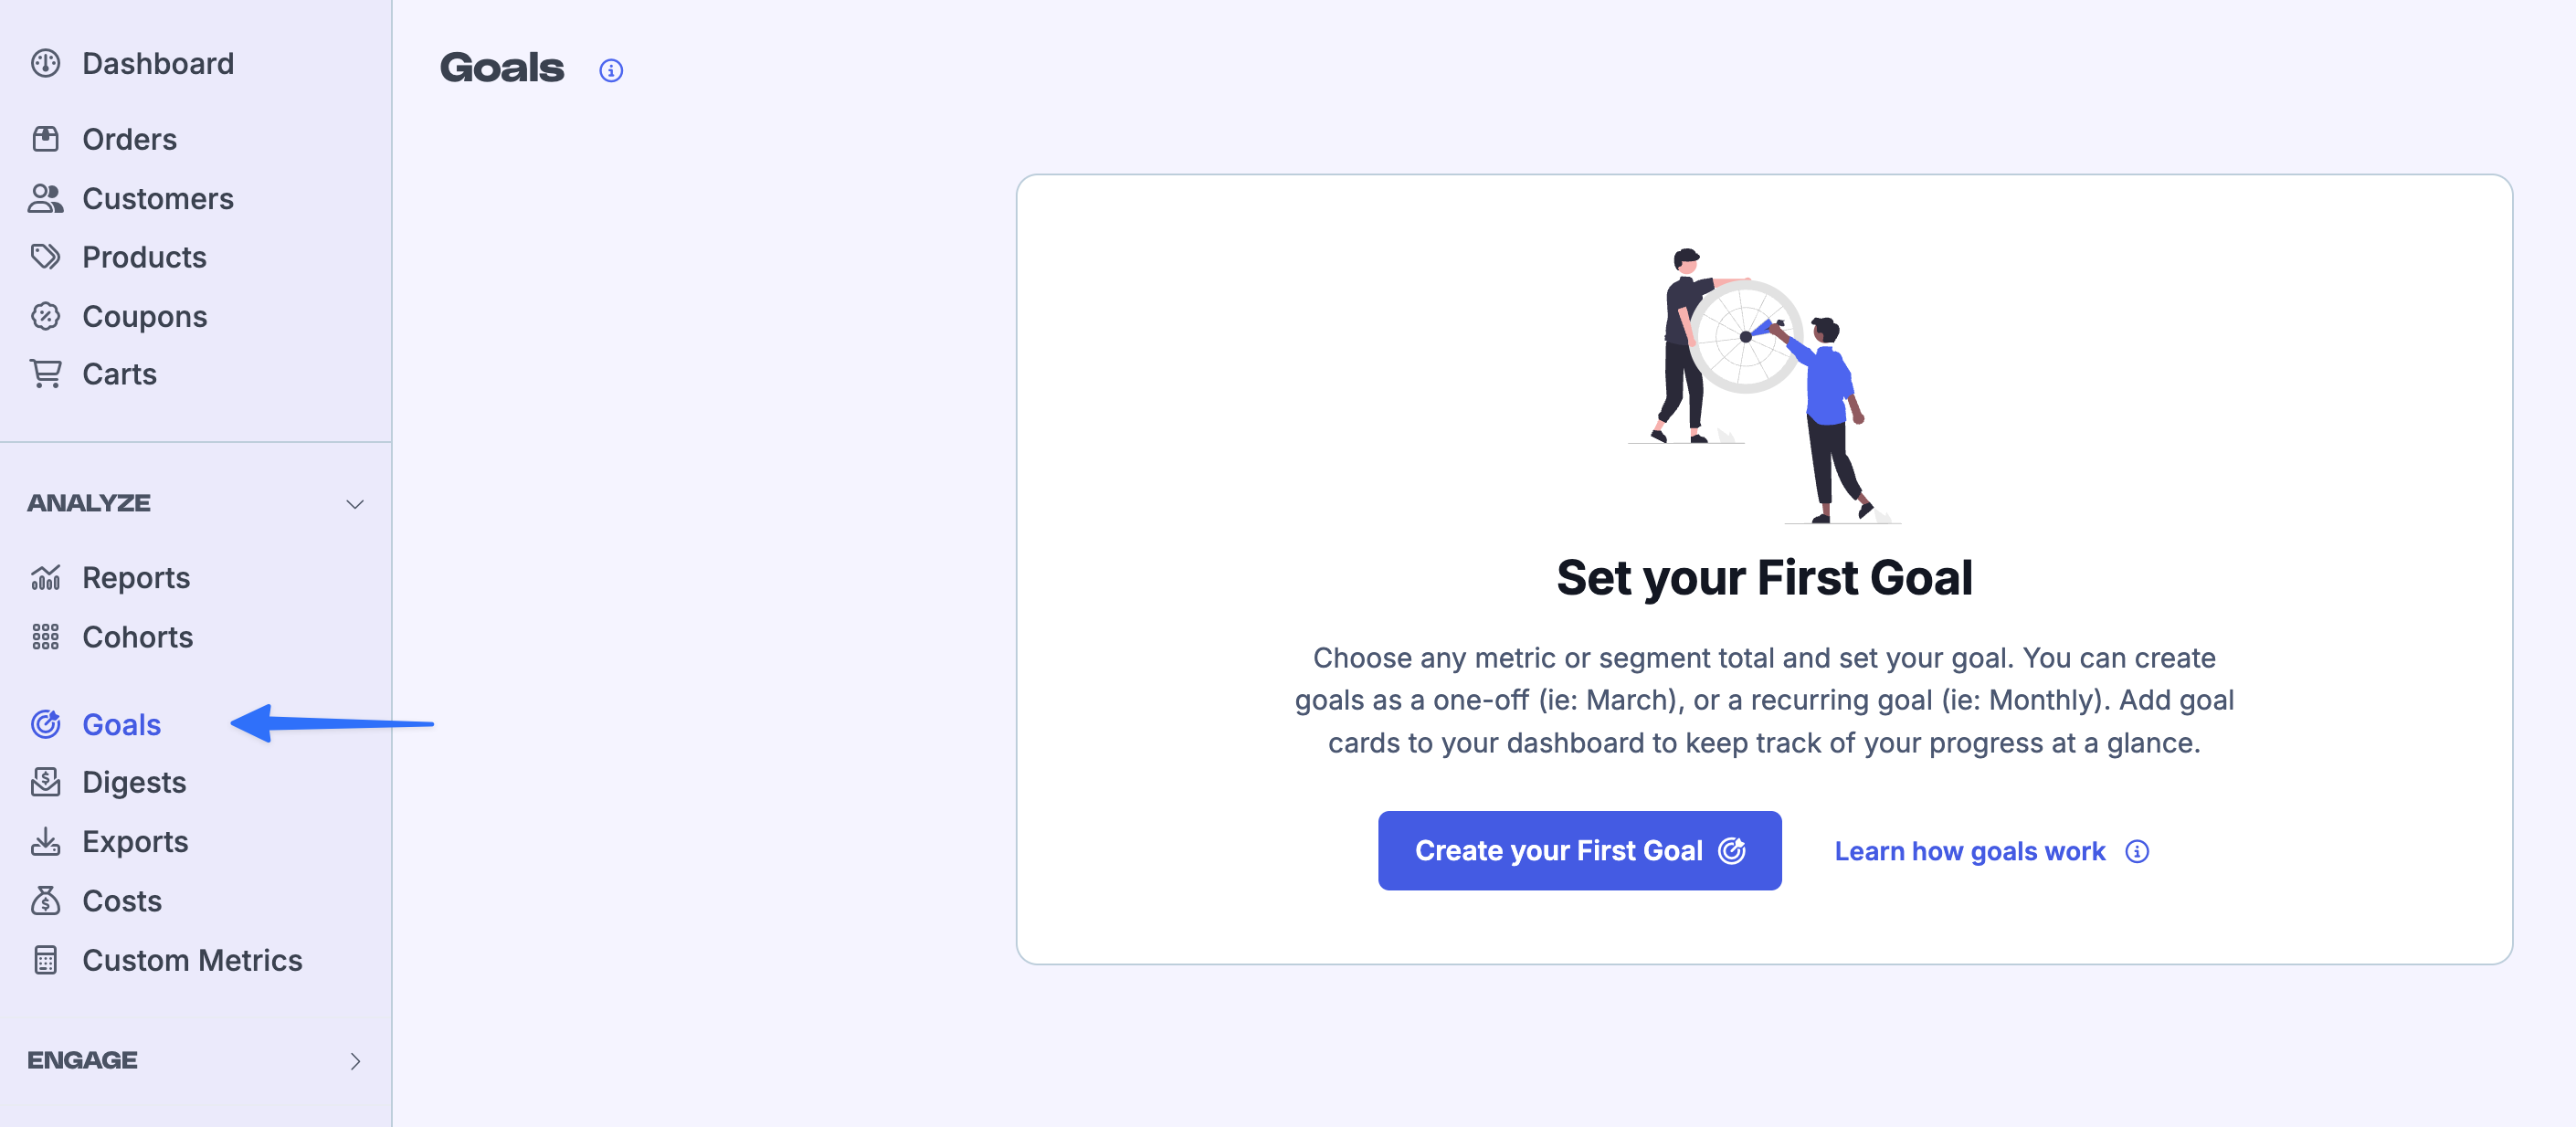
Click New Goal (or Create your First Goal if you have no goals yet).
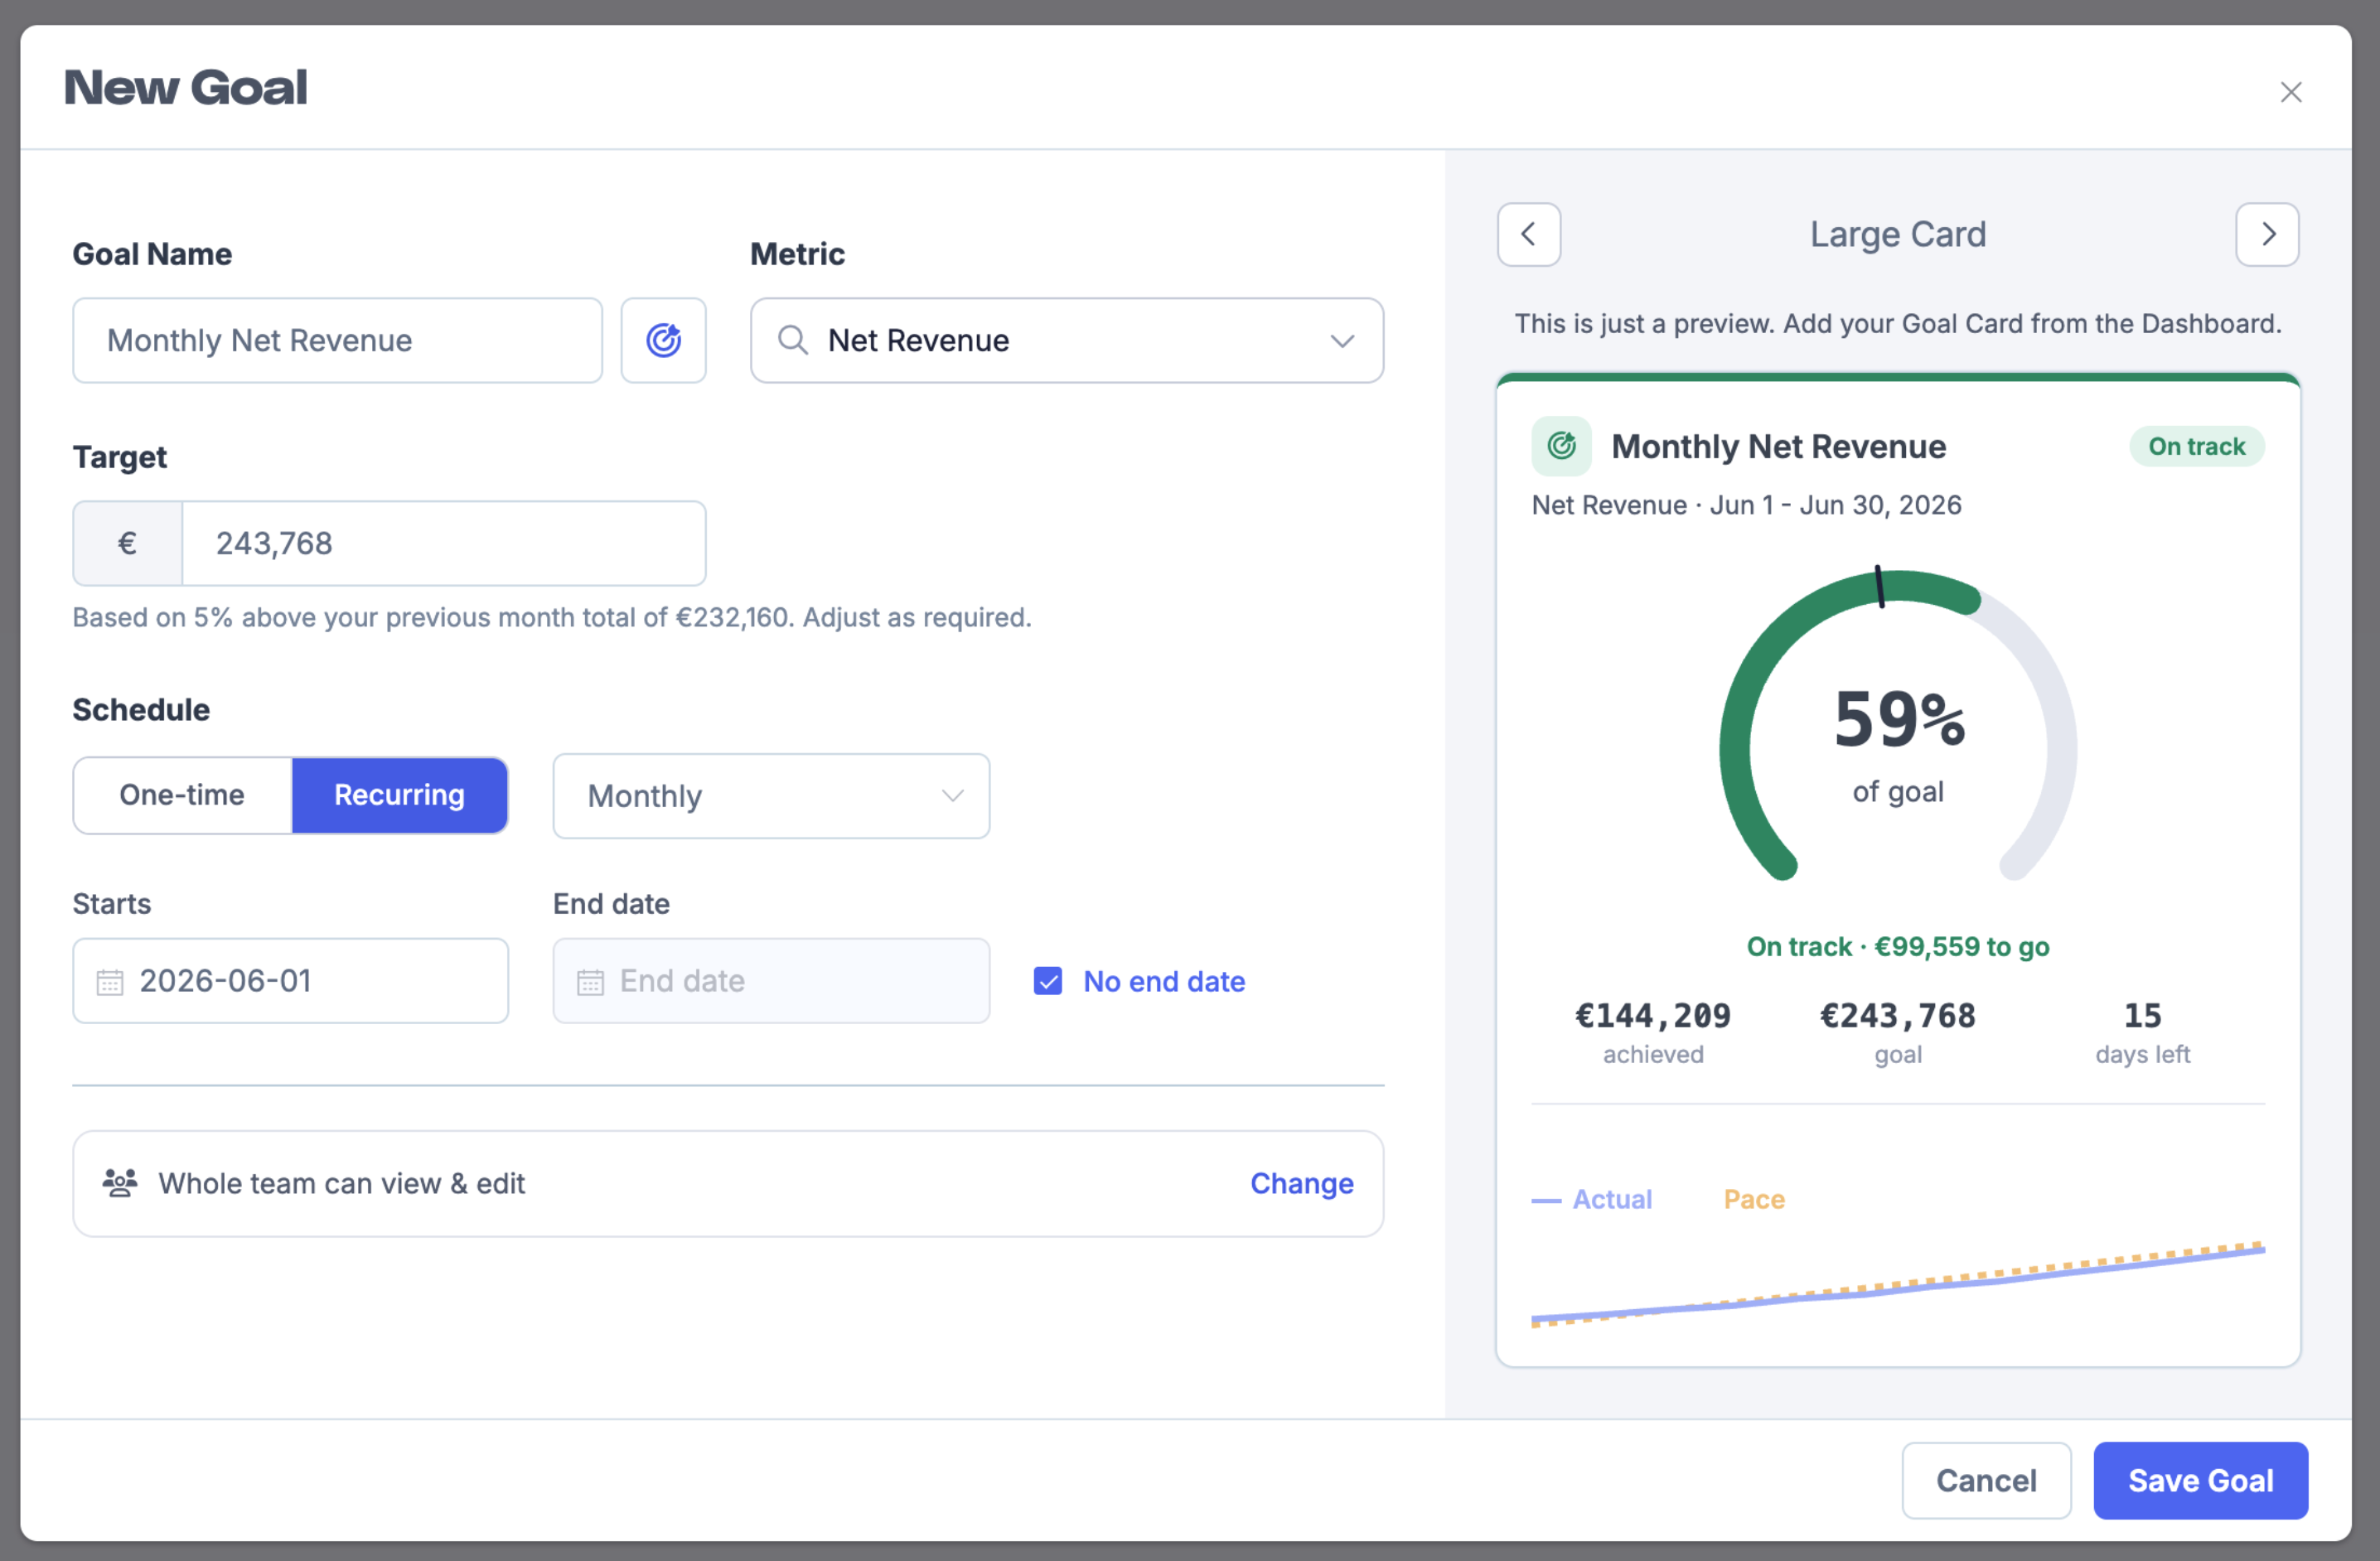
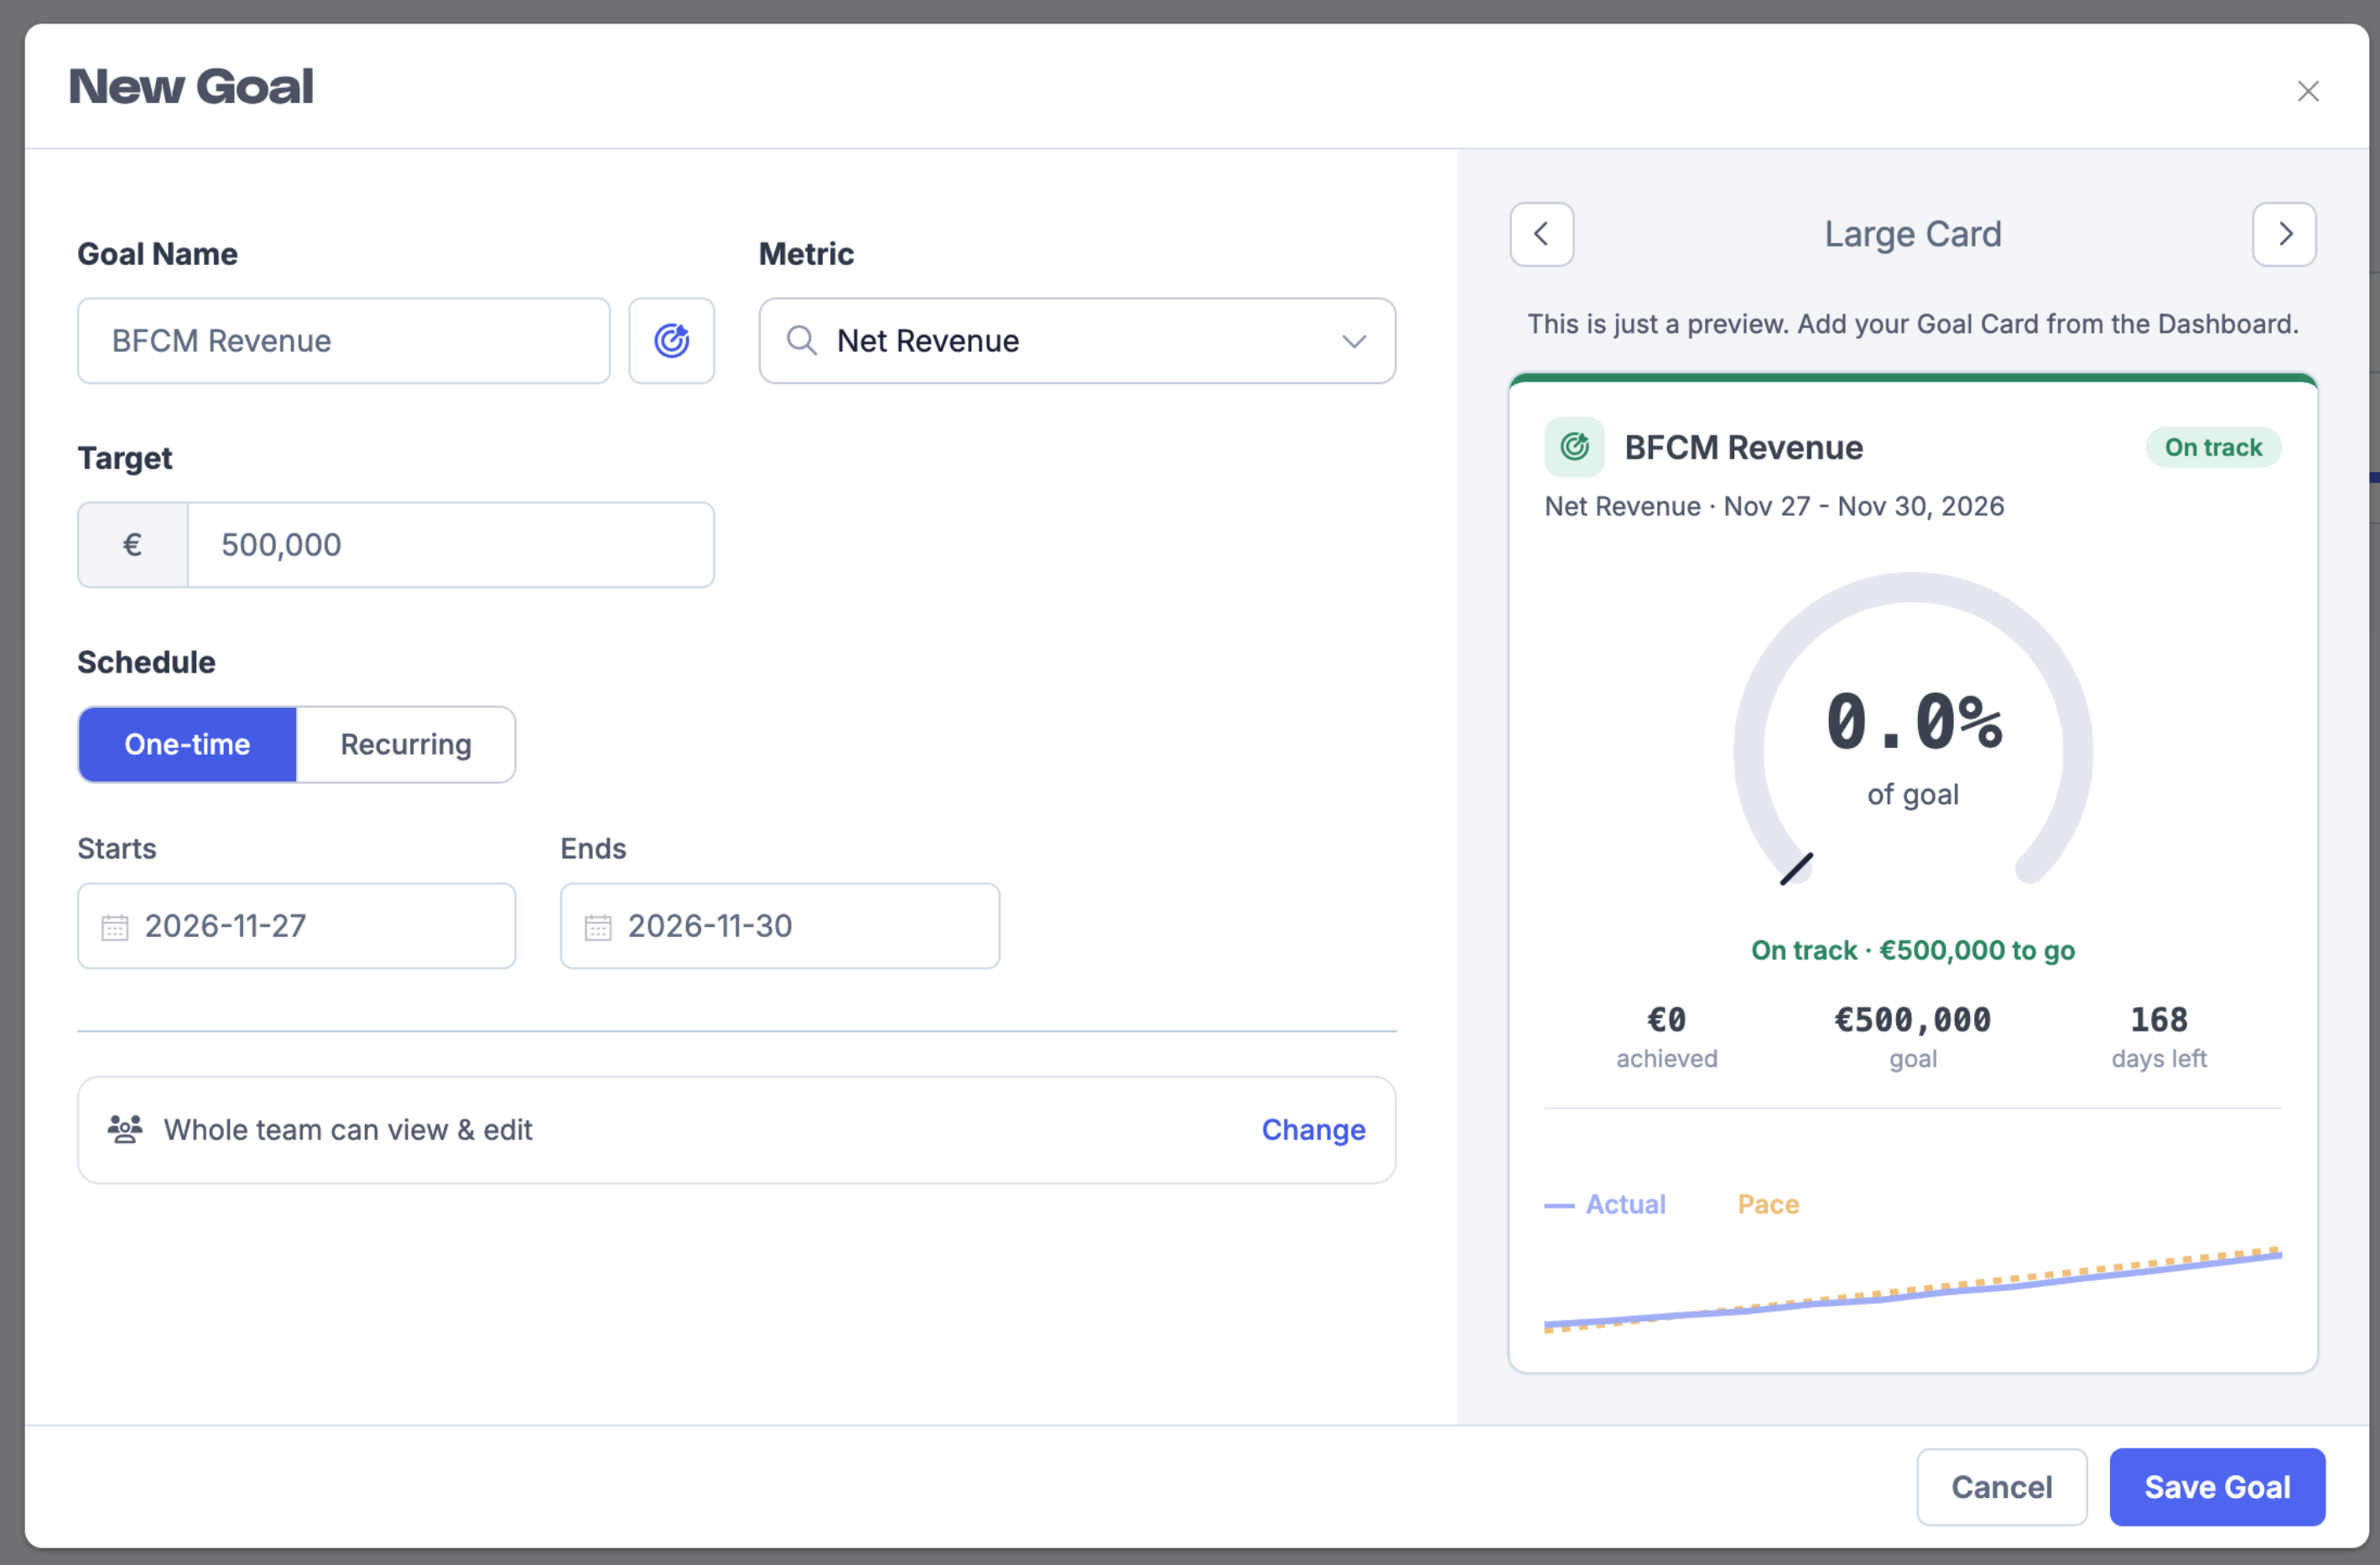
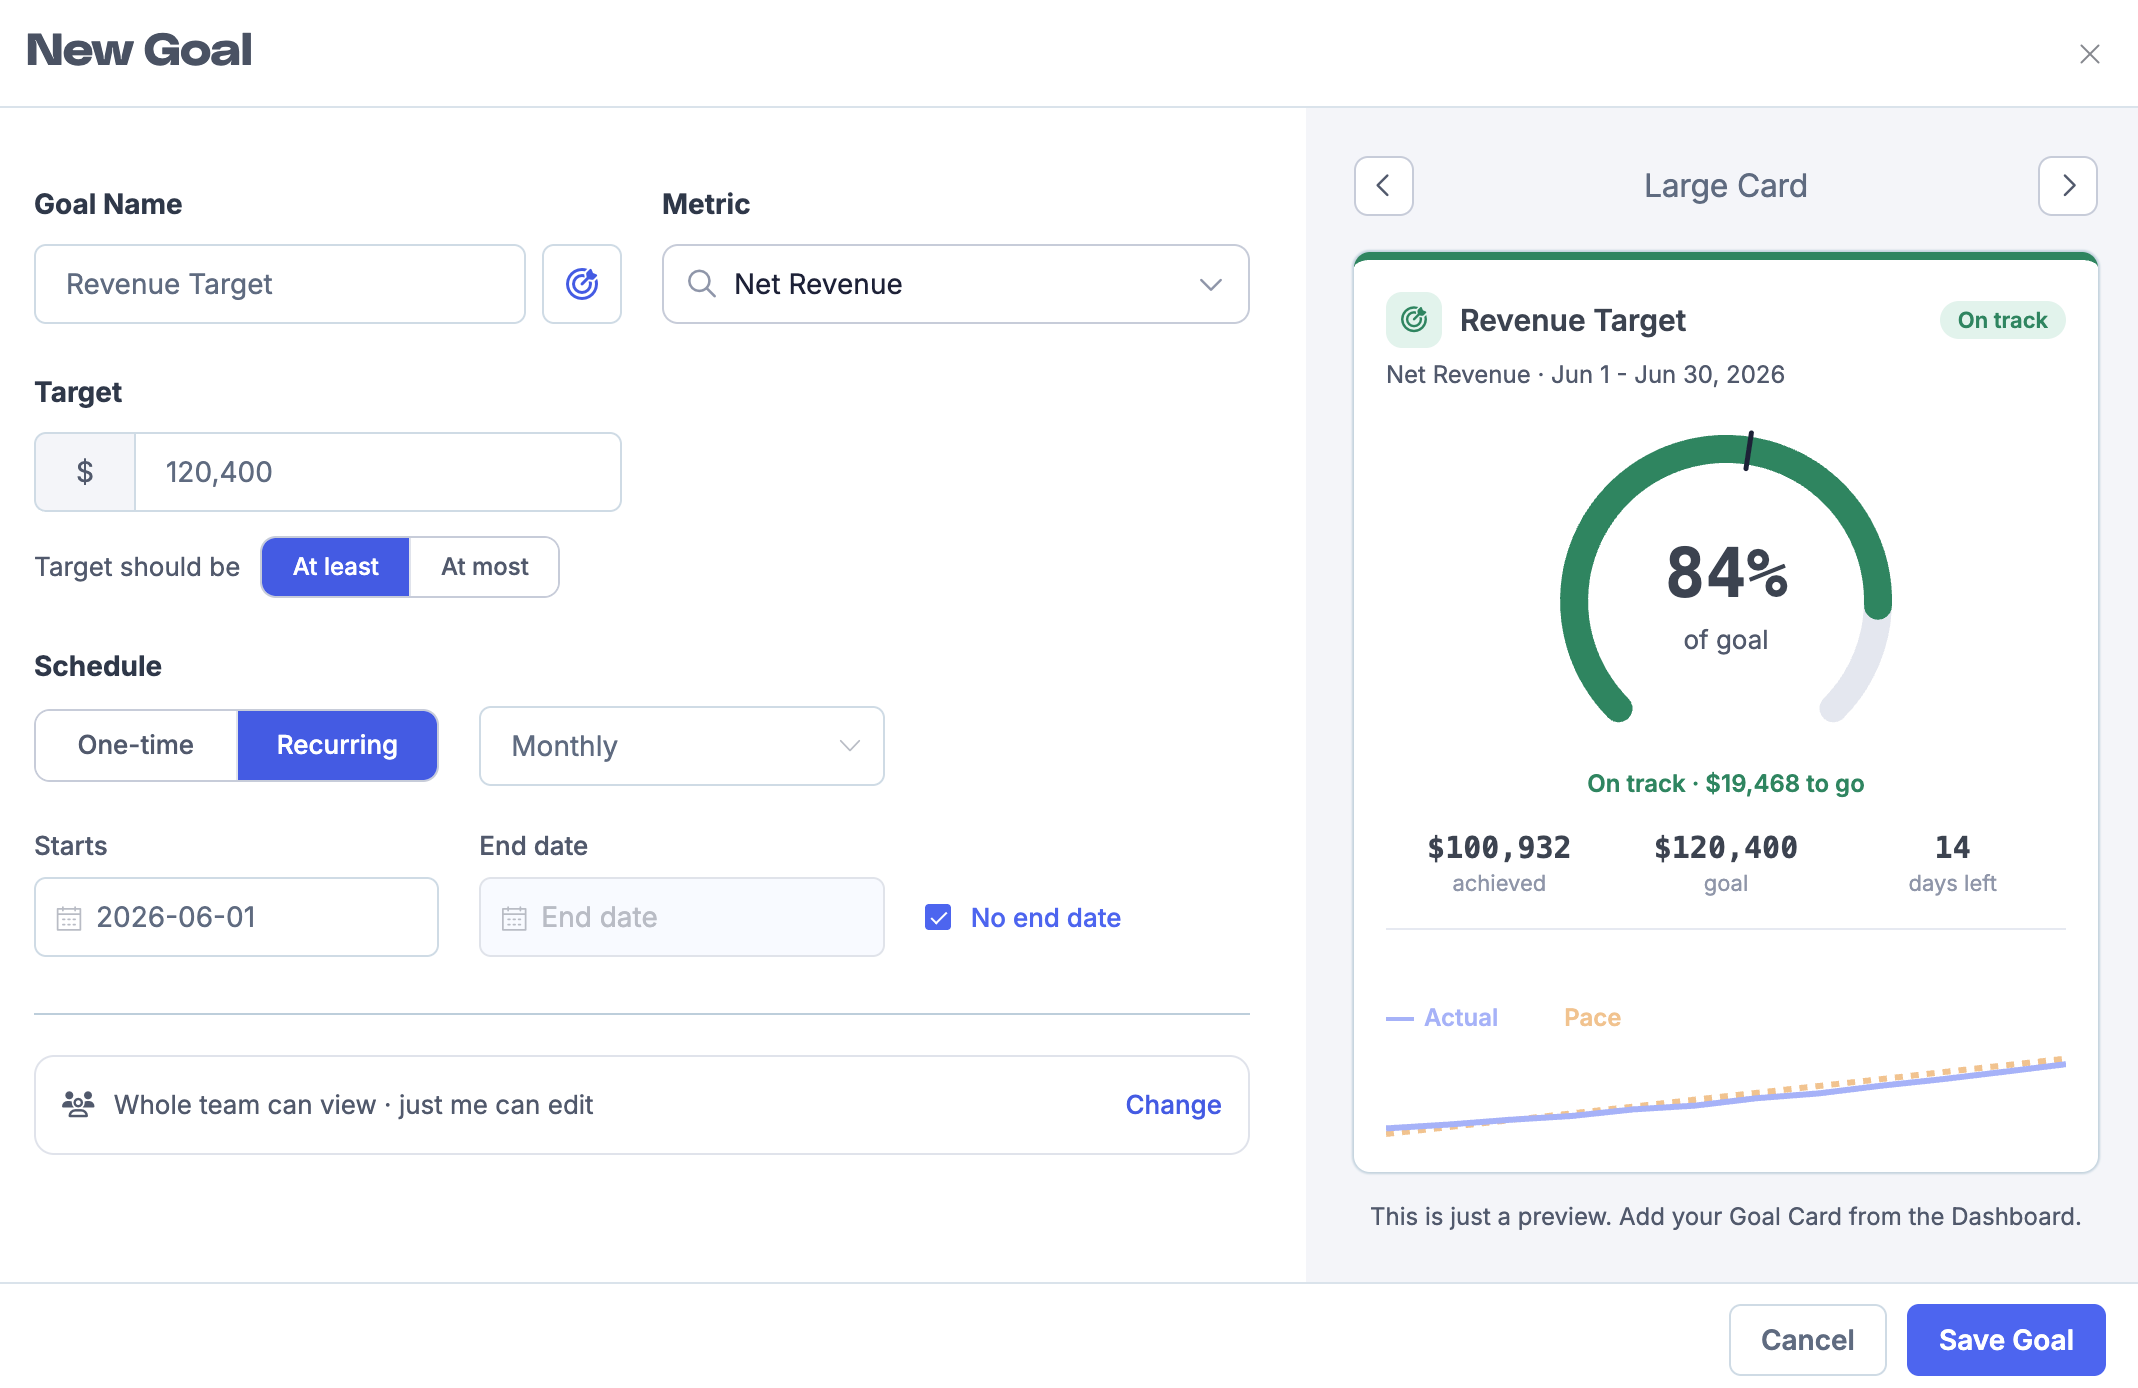
Enter a Goal Name, such as Monthly Net Revenue or BFCM Revenue.
Choose the Metric you want to track. Options include Net Revenue, New Customers, Net Sales, Gross Sales, Orders, and Items Sold. You can also use a custom metric.
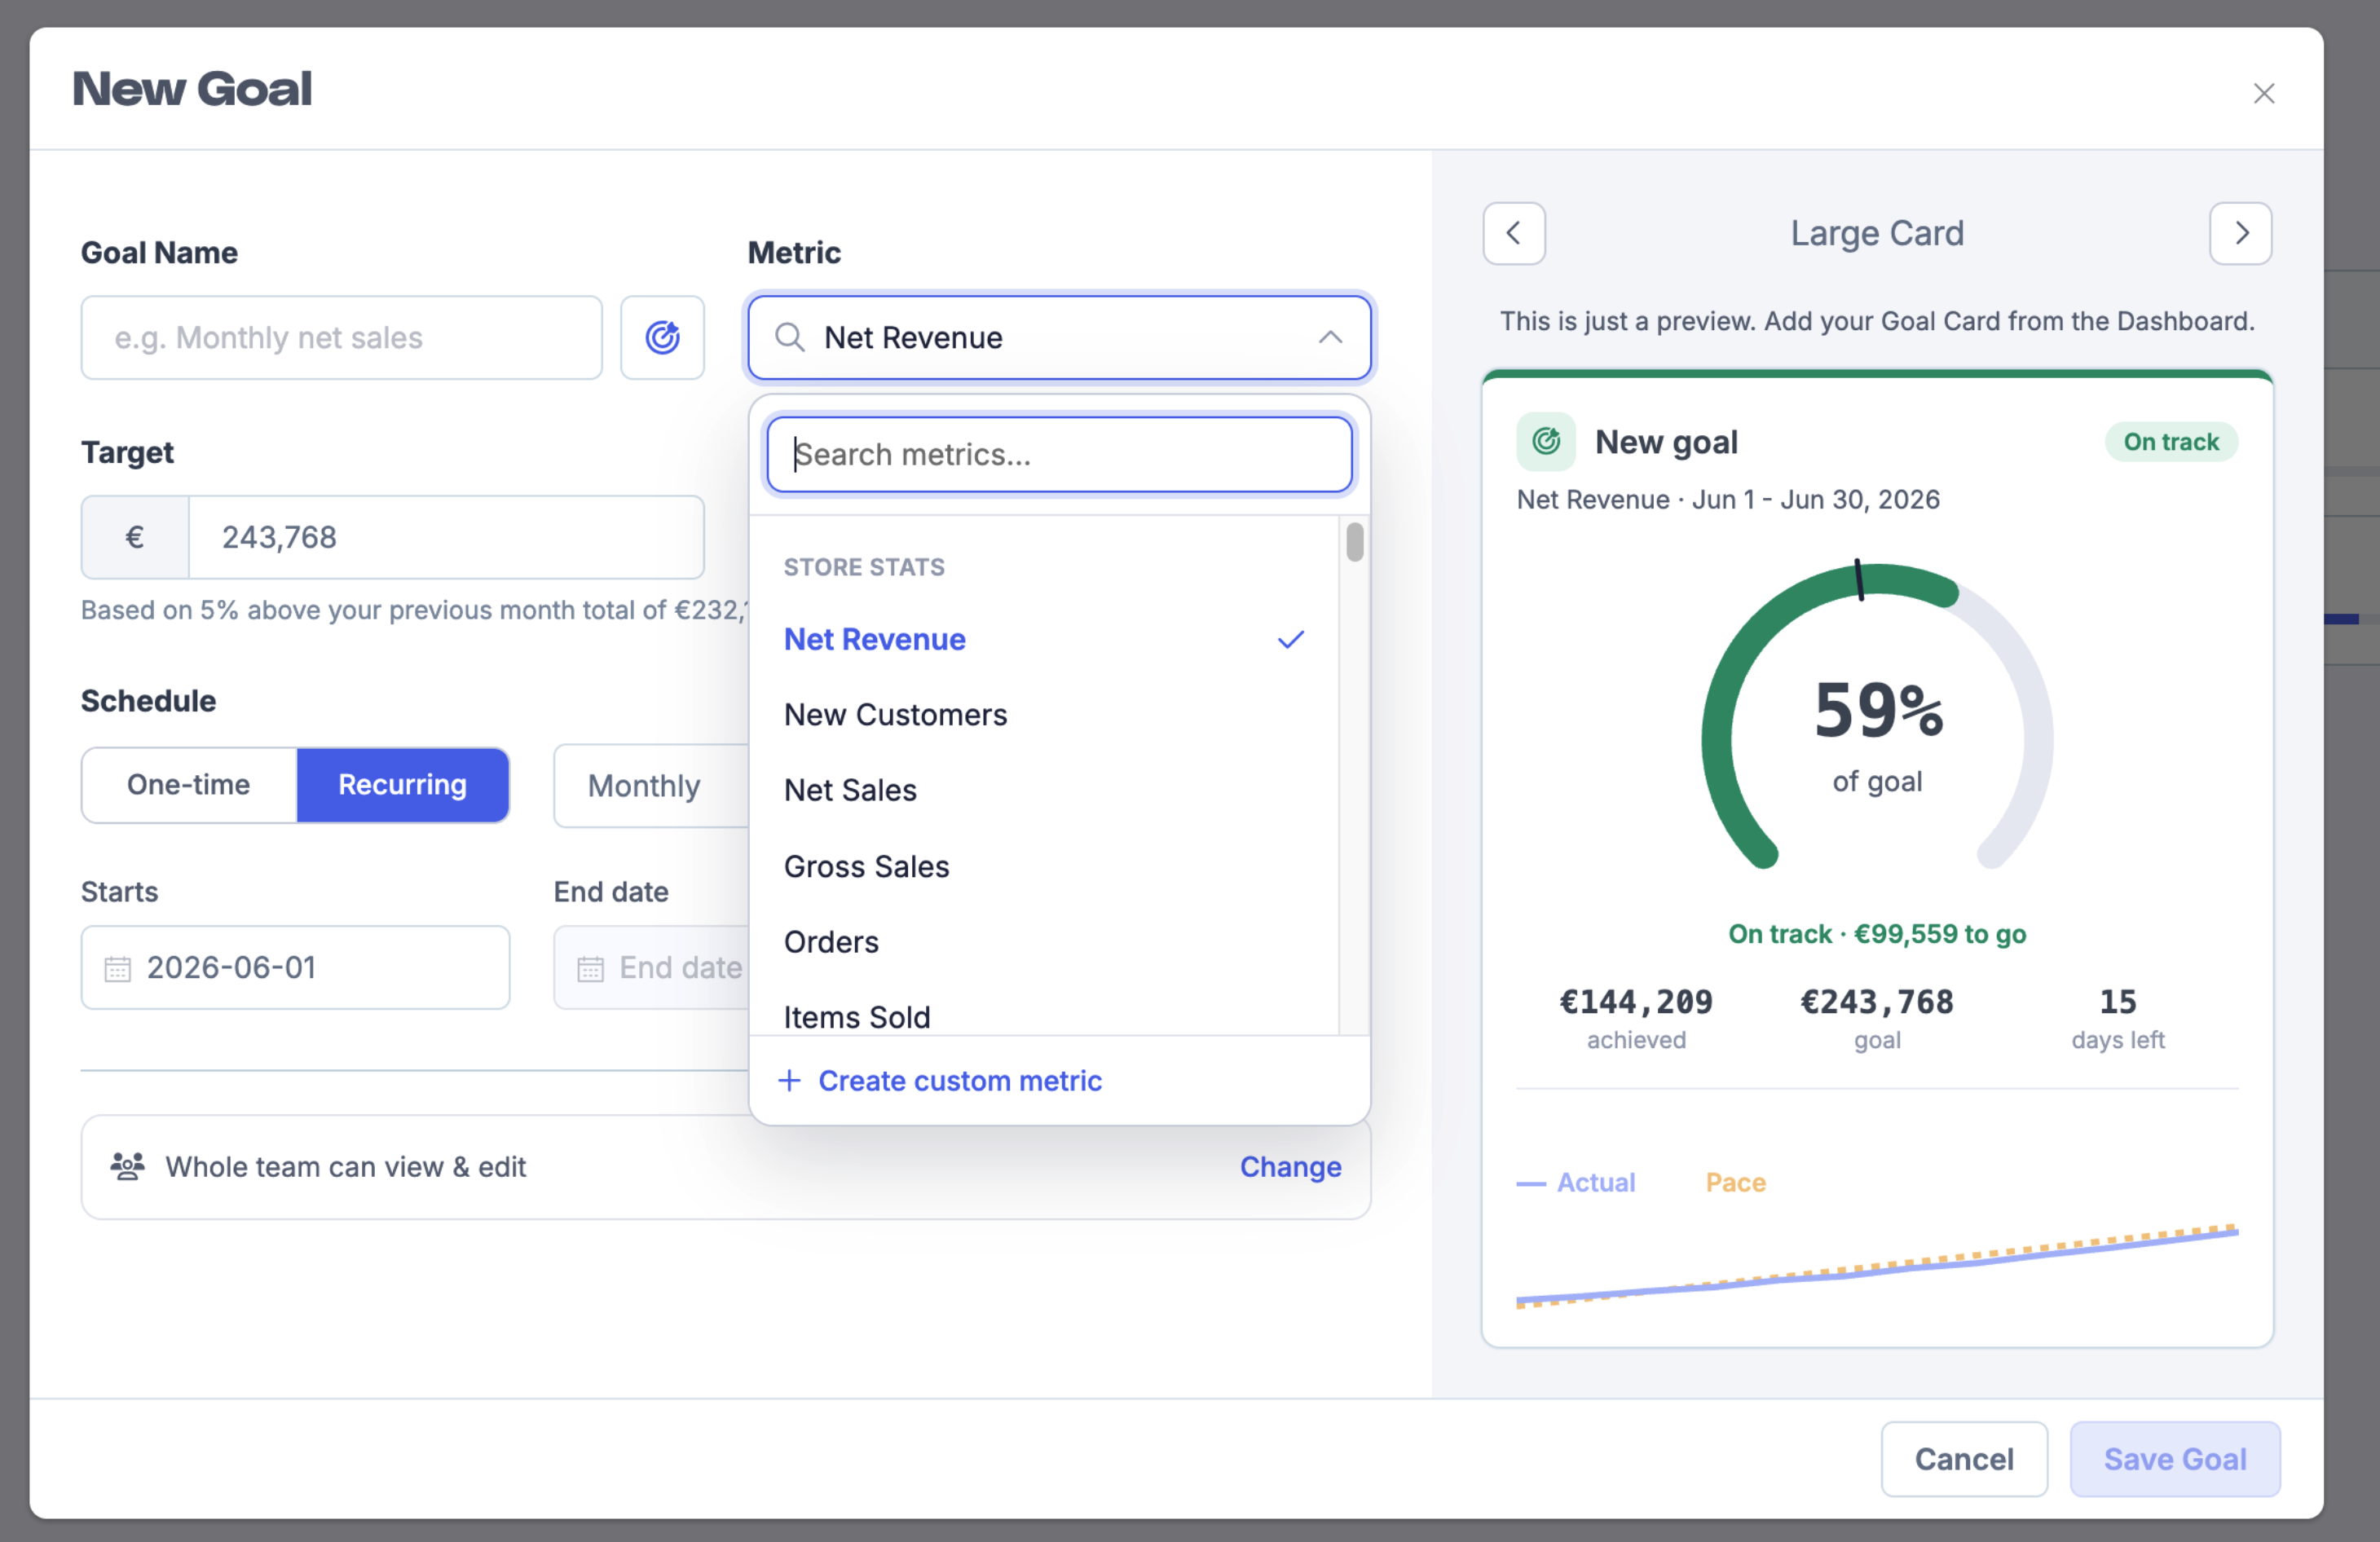
Set your Target amount. Metorik suggests a target based on 5% above your previous period total, but you can adjust it as needed.
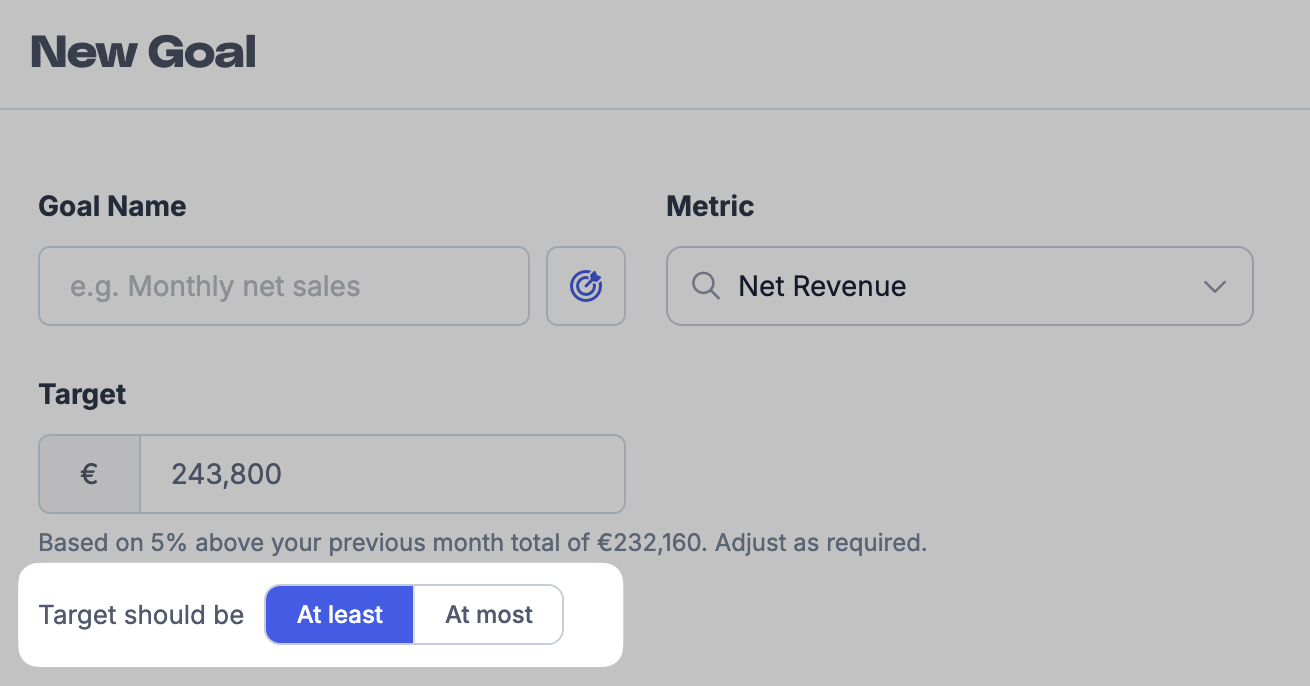
Under Target should be, choose whether the goal is At least or At most that value:
At least — for metrics where higher is better, such as revenue, orders, or new customers.
At most — for metrics where lower is better, such as customer acquisition cost or refunds.
Choose a Schedule:
One-time — for a fixed date range, such as a sale event or product launch.
Recurring — for repeating targets such as monthly or quarterly goals. Pick a preset frequency (Daily, Weekly, Monthly, Quarterly, or Yearly) or choose Custom to set your own interval.
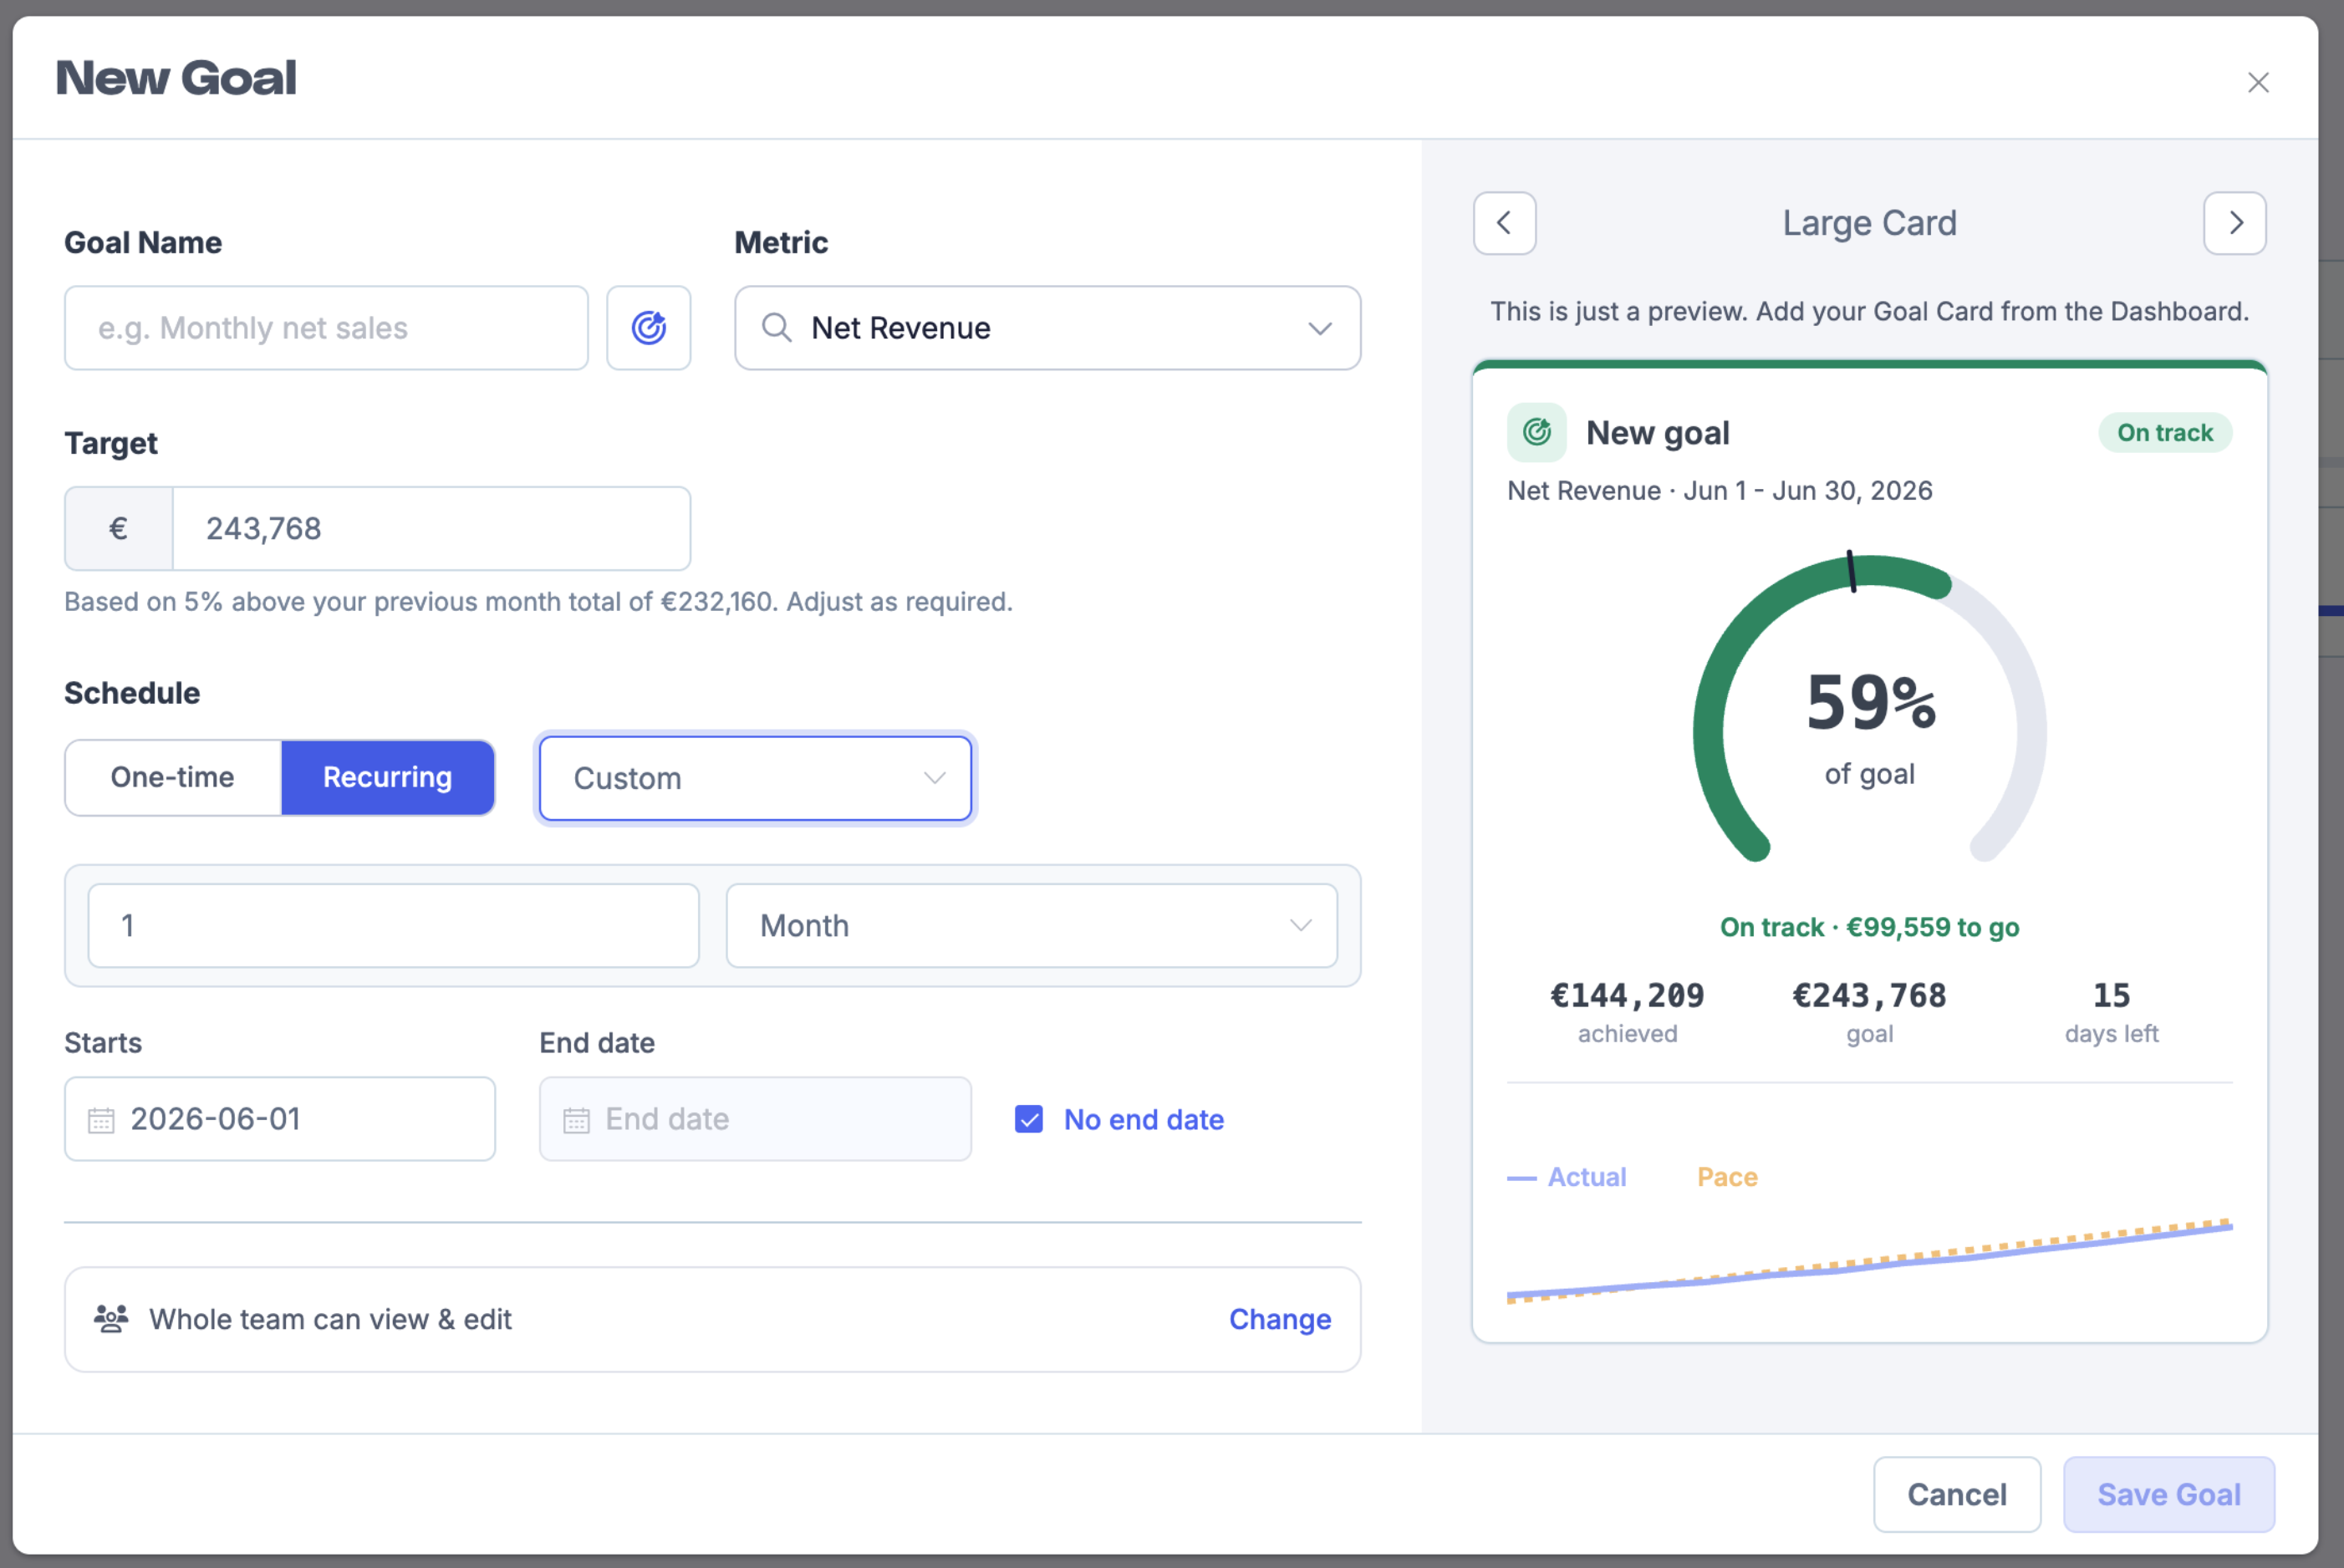
Set the Starts date. For one-time goals, set an Ends date too. For recurring goals, you can leave No end date checked so the goal continues indefinitely.
Review the live preview on the right, then click Save Goal.
The preview shows how the goal card will appear on your dashboard, including progress percentage, amount achieved, and whether you are on track or ahead of pace.
View and manage goals
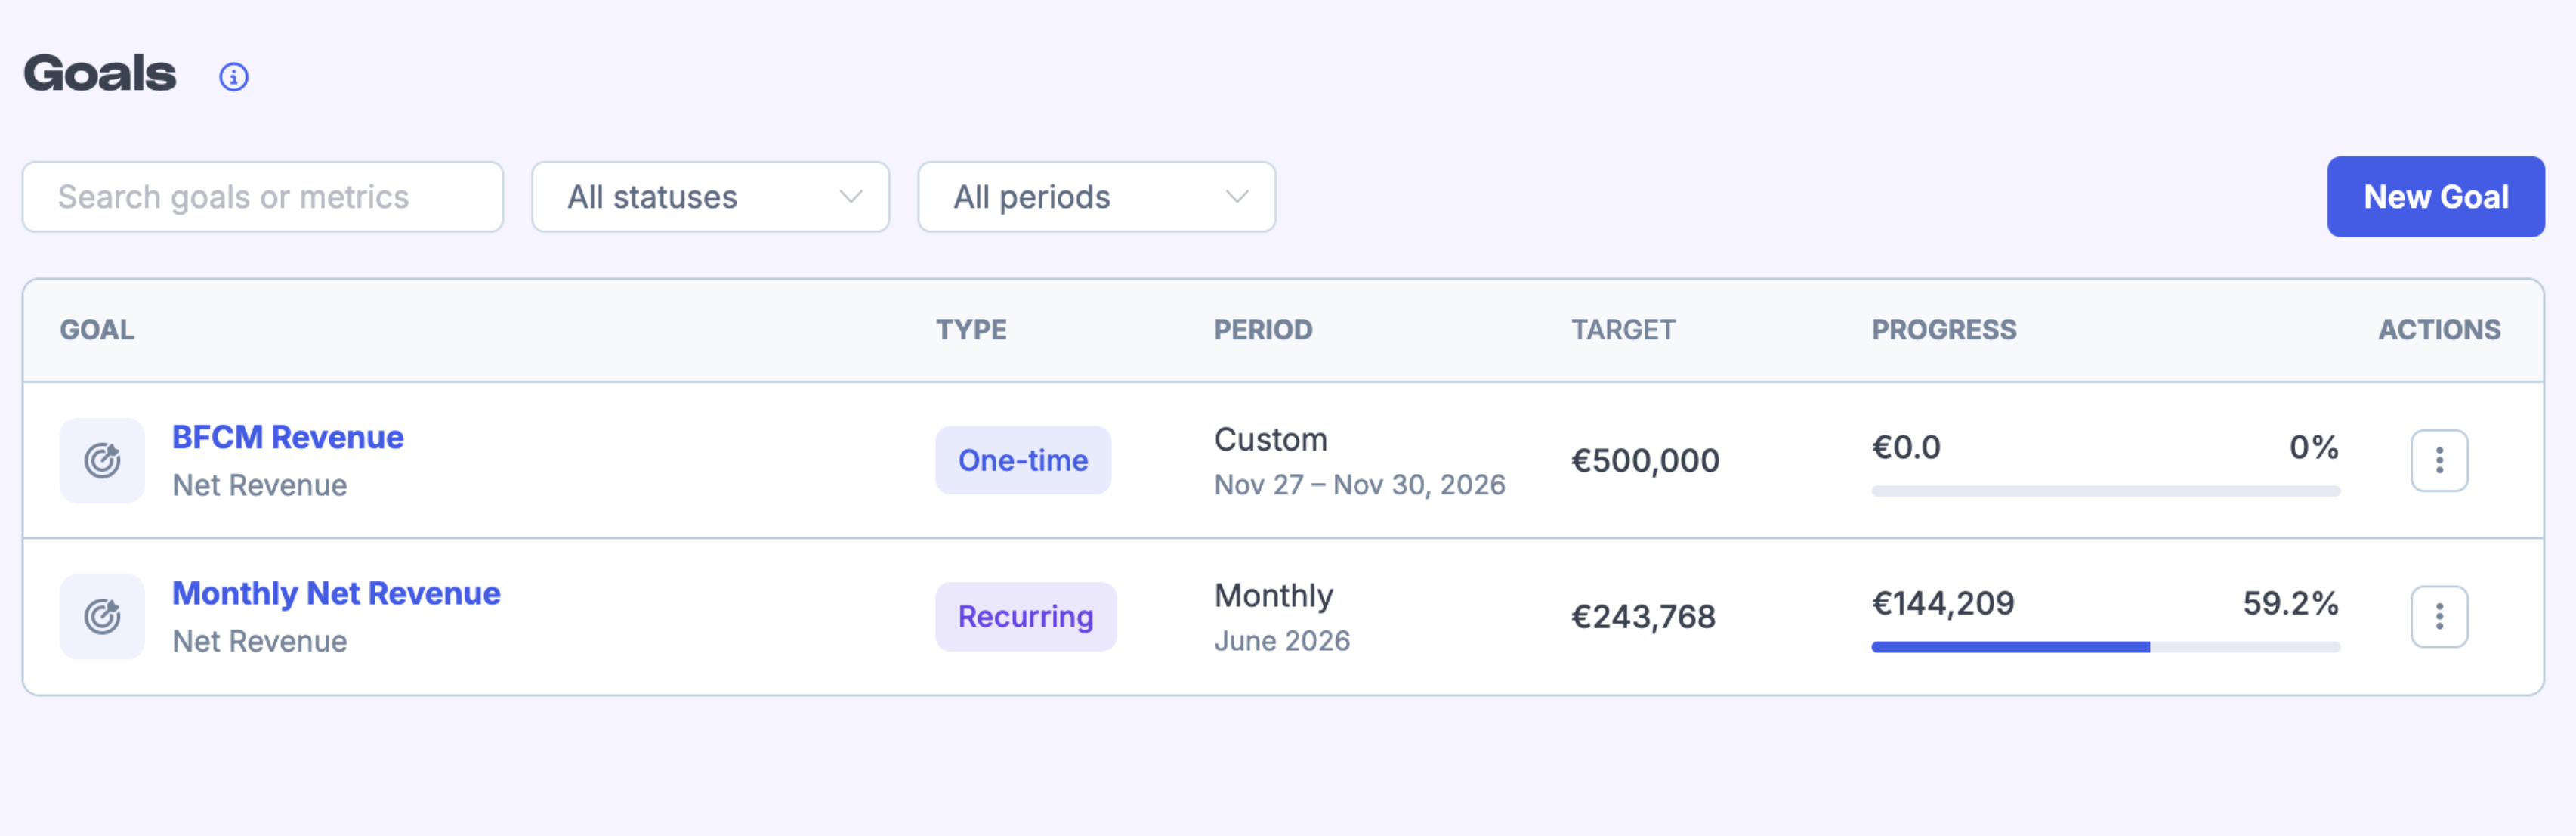
On the Goals page, you see a list of every goal with its type, period, target, and current progress. Use the search bar or the All statuses and All periods filters to find a specific goal.
Click a goal to open its detail page. The detail page shows:
A summary of current progress versus target, including percentage complete and amount remaining.
Your status — for example, On track or Ahead of pace — and how far ahead or behind you are compared to the expected pace.
A Progress over time chart comparing your Actual results against the Pace line.
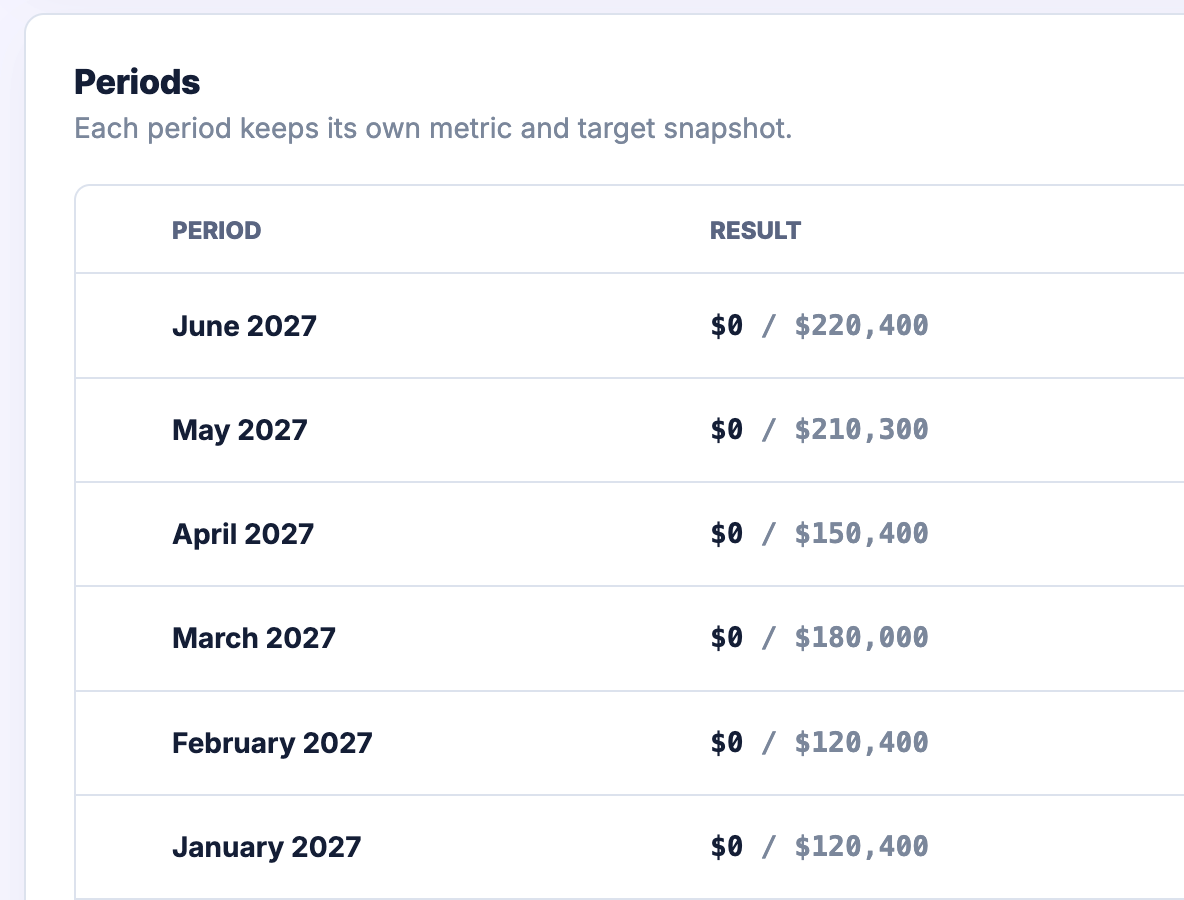
A Periods table showing each completed or current period, its result, progress, and status.
Each period keeps its own metric and target snapshot, so historical results stay accurate even if you change a goal later.
Edit recurring goal period targets
When you have a recurring goal, you can edit the target for any individual period — past or future — directly from the goal detail page. This is useful for seasonal stores where targets vary month to month, or when you want to correct a past period after it ends. Instead of creating separate one-time goals for each month, use a single recurring goal card that automatically updates to the current period.
Set up a Recurring goal with your preferred schedule (for example, Monthly).
After saving, open the goal detail page and scroll to the Periods table. Check the Future periods checkbox to show upcoming periods.
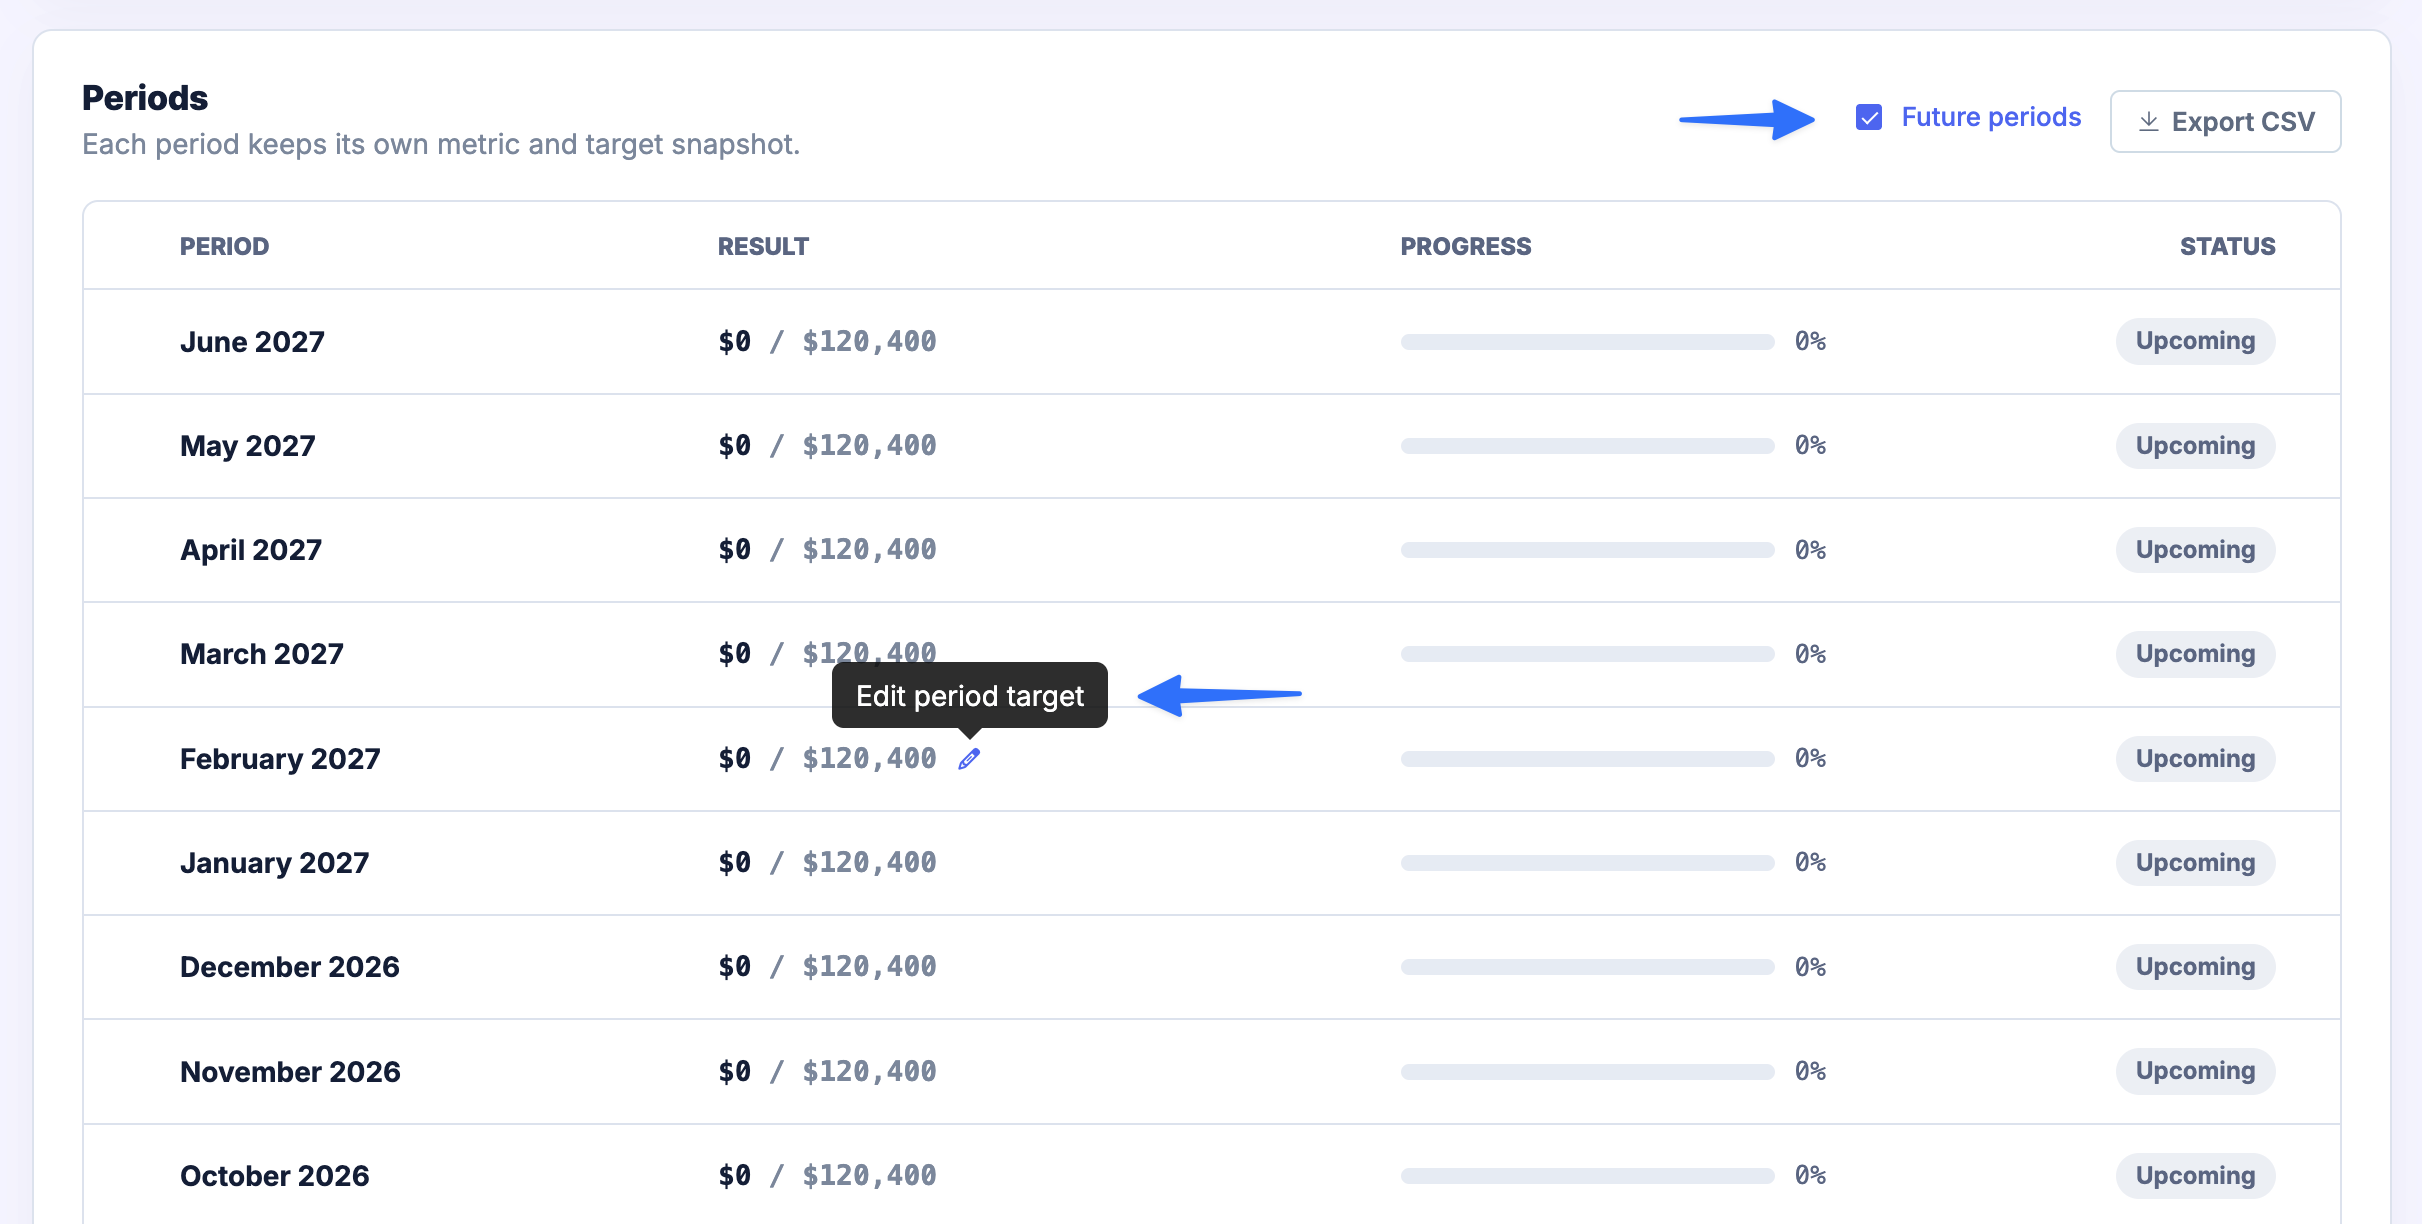
Click the pencil icon next to any period to edit its target.
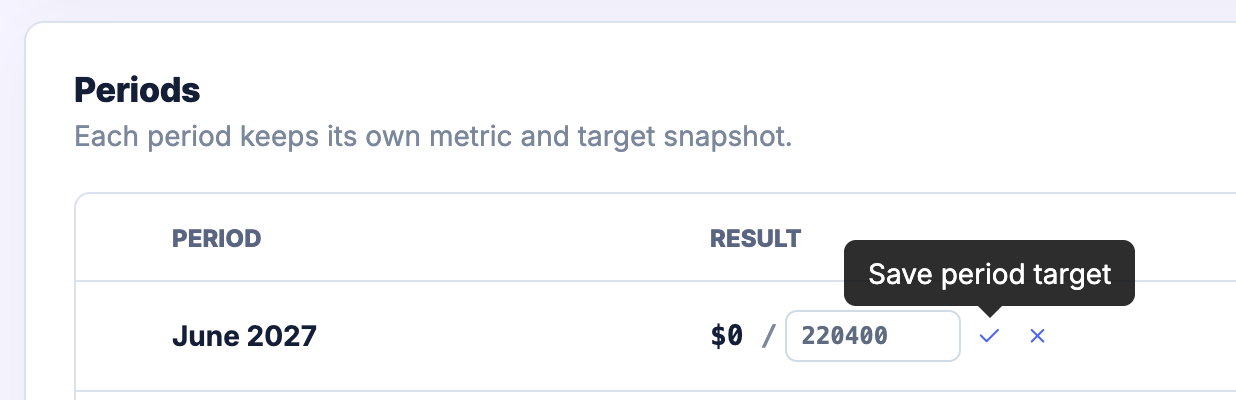
Enter the new target value and click the checkmark to save, or the X to cancel. The table shows the updated target for that period while other periods keep their original values.
Instead of creating a separate one-time goal for each month, set up a single recurring goal and edit the target for each period. The goal card on your dashboard will automatically update to the current period's target.
You can also edit past periods that have already ended. This lets you update the historical target if your original plan changed after the period closed.
Add a goal card to your dashboard
Go to your Dashboard and click Customise. See Customising the Dashboard for more details on working with cards.
In the card picker, select Goal as the card type.
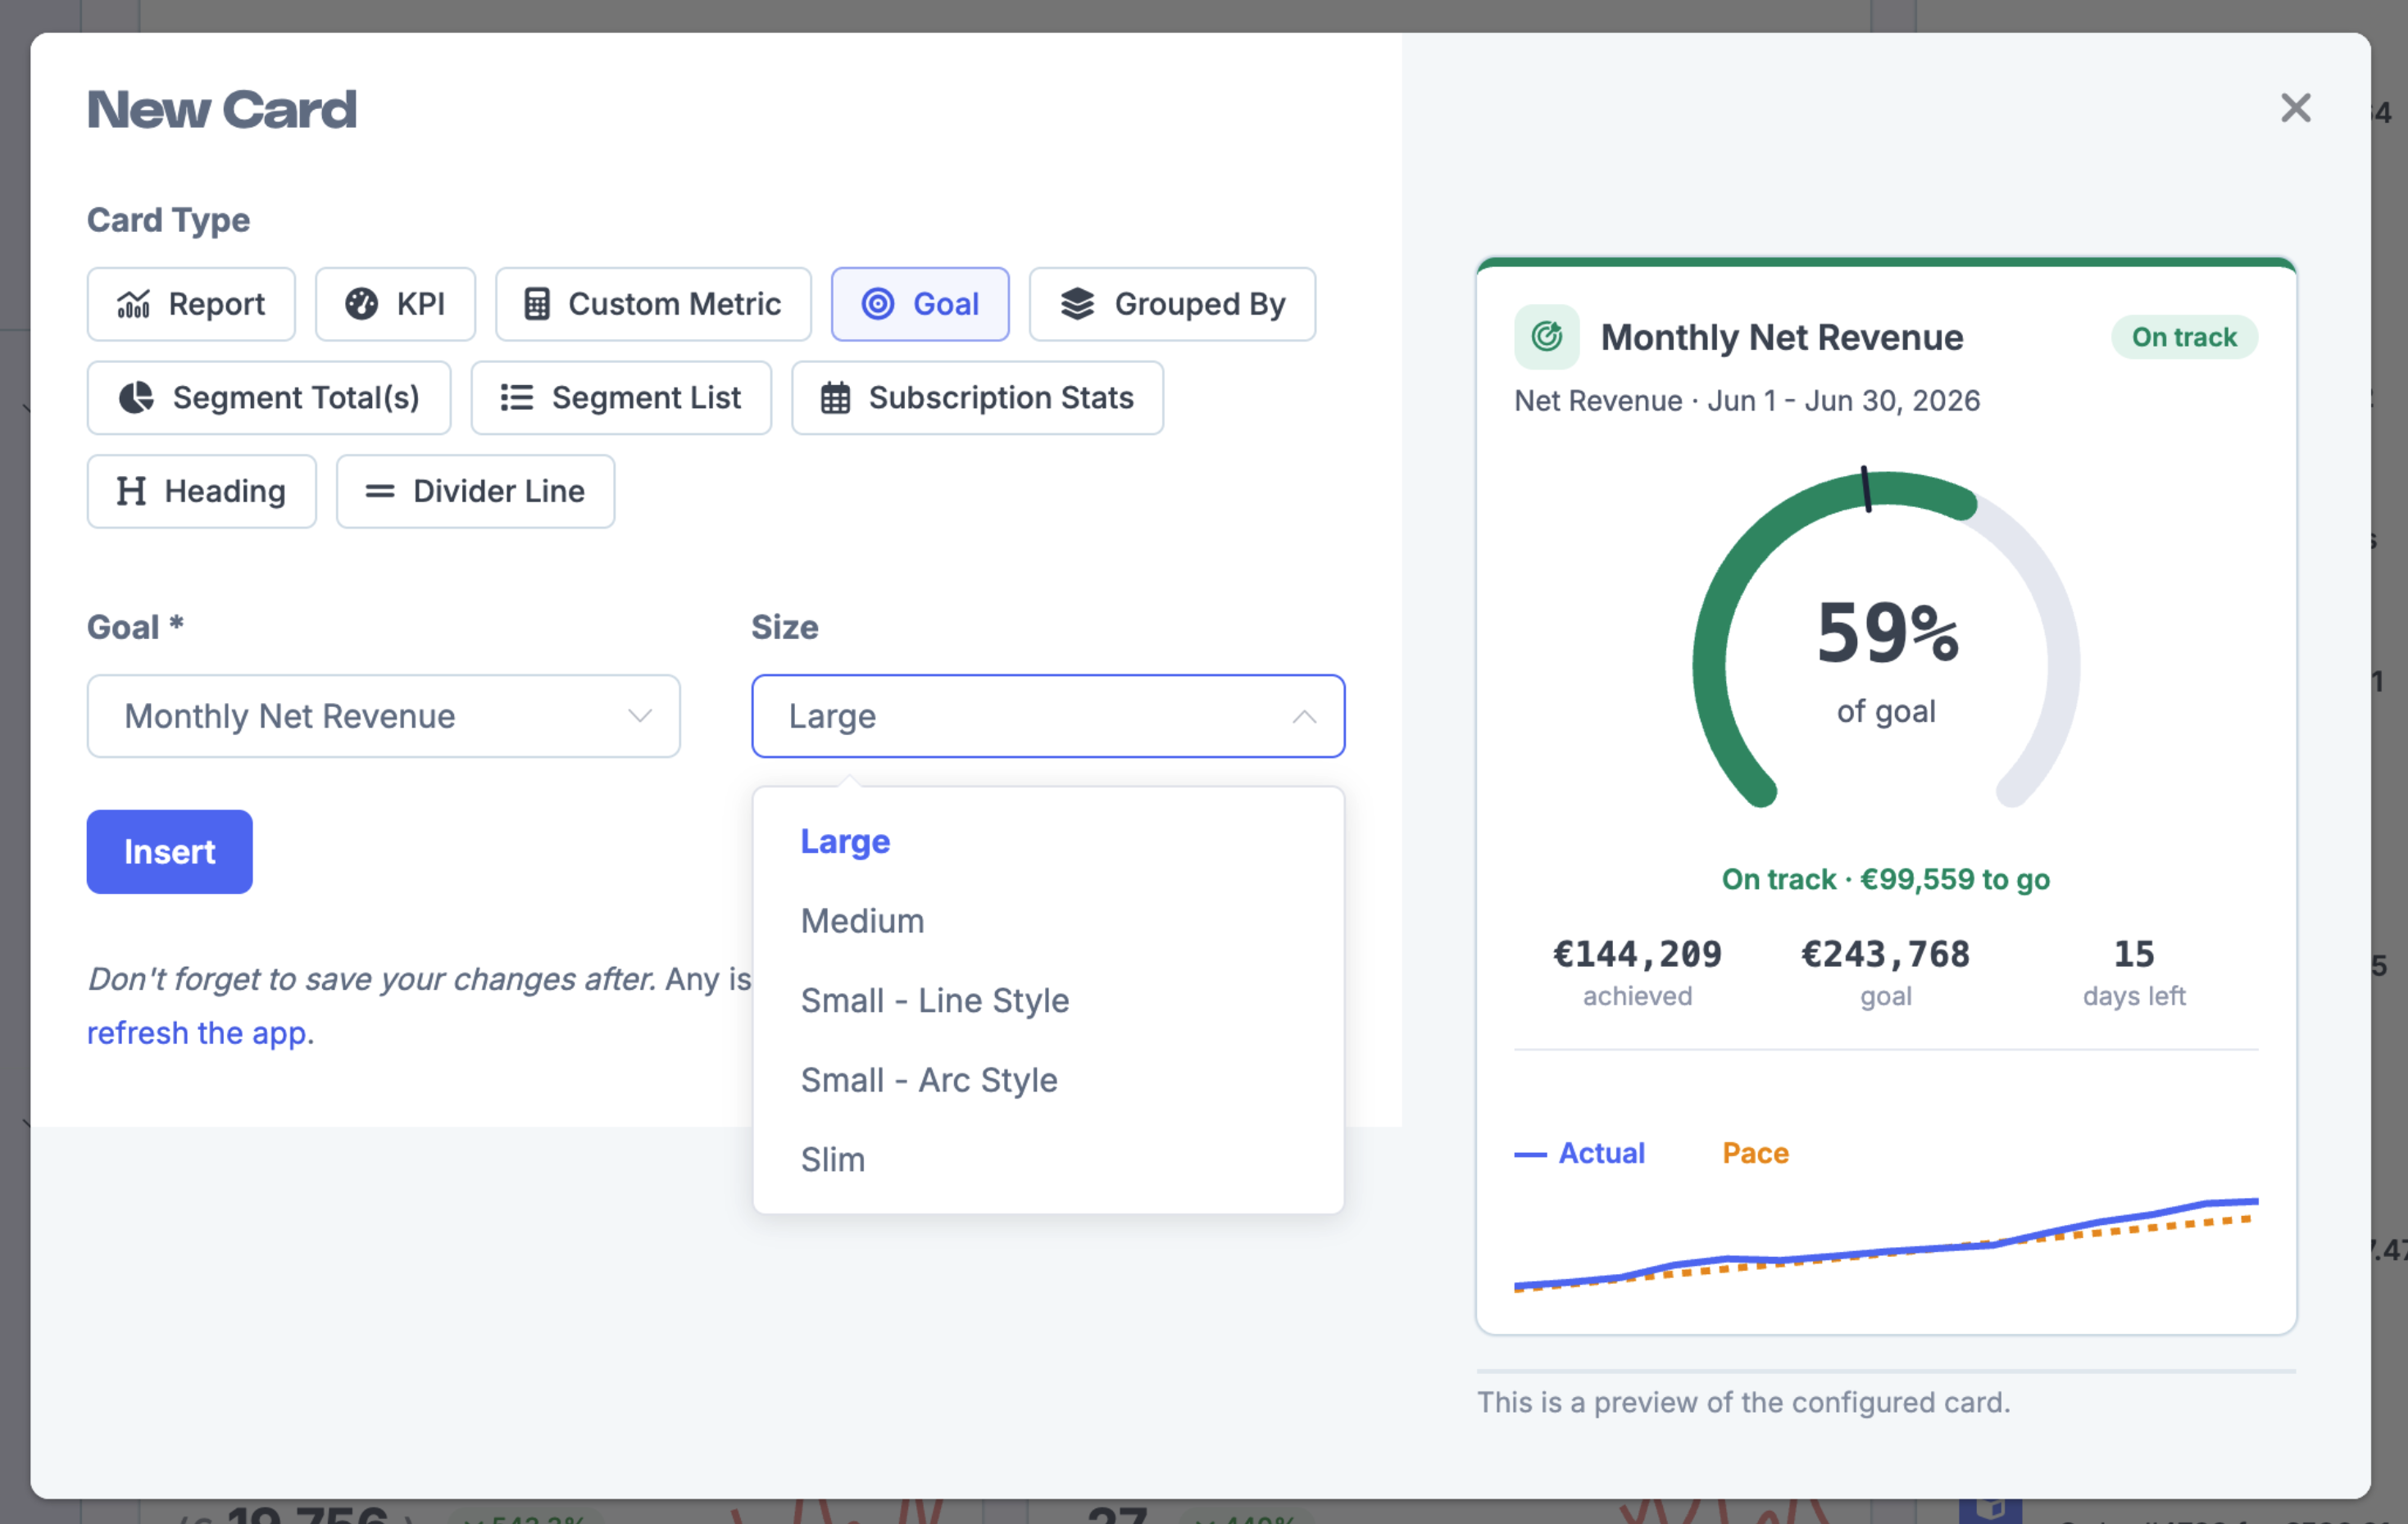
Choose the goal you want to display.
Pick a size:
Large — full progress circle, stats, and trend chart.
Medium — compact version.
Small – Line Style or Small – Arc Style — minimal indicators.
Slim — a narrow progress bar.
Click Insert, then save your dashboard changes.
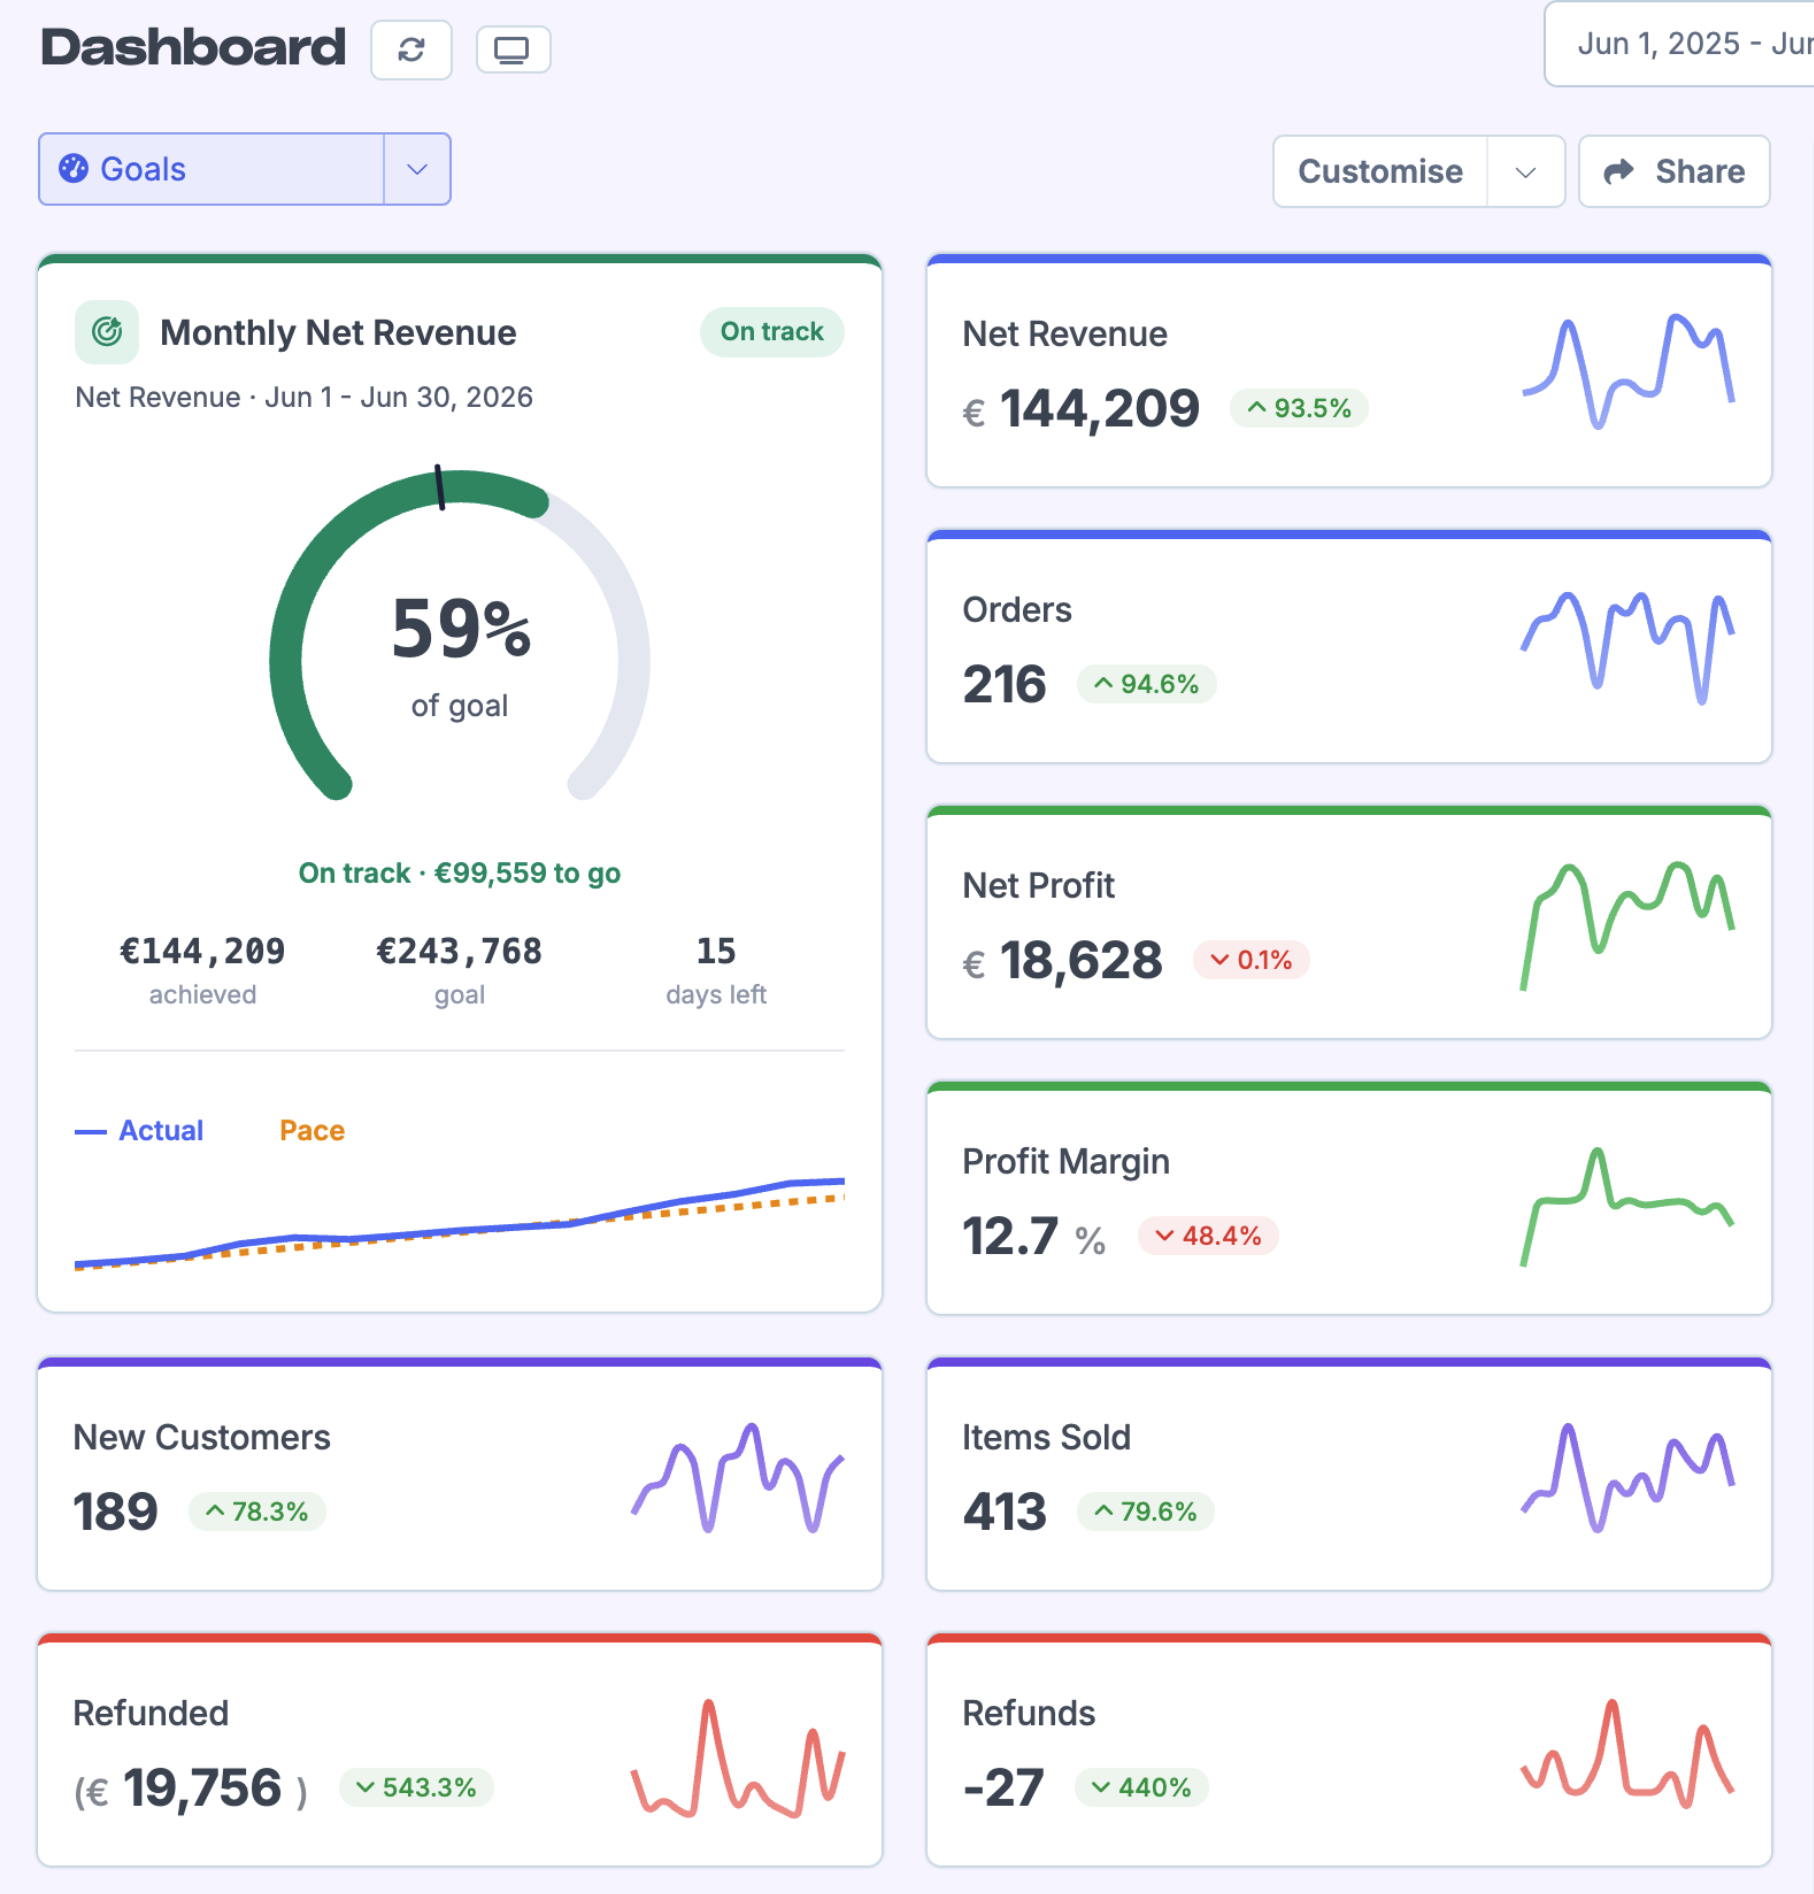
Goal cards update automatically as new data comes in, so your dashboard always shows the latest progress.
Goal permissions
By default, goals are visible and editable by your whole team. When creating or editing a goal, click Change next to the permission row to adjust who can view or edit it.