Forecasting Data
Metorik has a powerful forecasting system that allows you to forecast nearly any chart in the entire app. There is also a dedicated forecast report which allows you to quickly see sales, order, and customer forecasts.
We compare several trend and seasonal models against your store’s historical results, then use the strongest candidates to forecast future values. Forecasts are calculated within Metorik, without sending your data to an external forecasting service.
Forecasts, like many things in life, are not certain, and should only be used as a guide. A forecast is only as good as the data that goes into it - keep that in mind when viewing smaller periods of time or when working with limited data.
Forecast Report
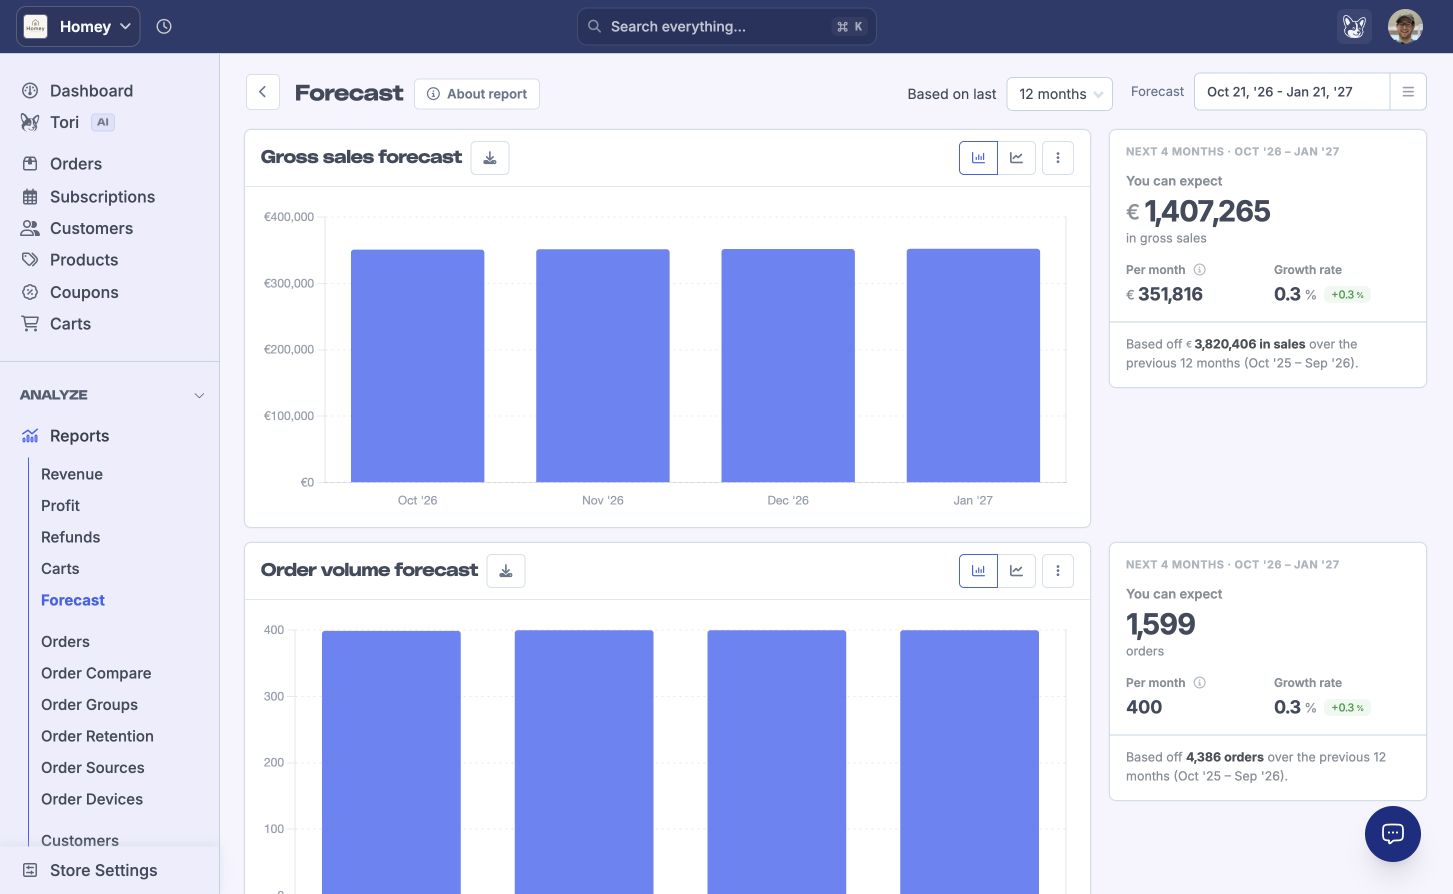
The forecast report is a good starting point to see forecasts for gross sales, order volume, and new customers.
Use Based on last in the top right to choose how much historical data to use. The report defaults to 12 months when enough history is available. The available options depend on your store’s history.
Use the Forecast date picker to choose the future period you want to forecast.
Forecast any chart in Metorik
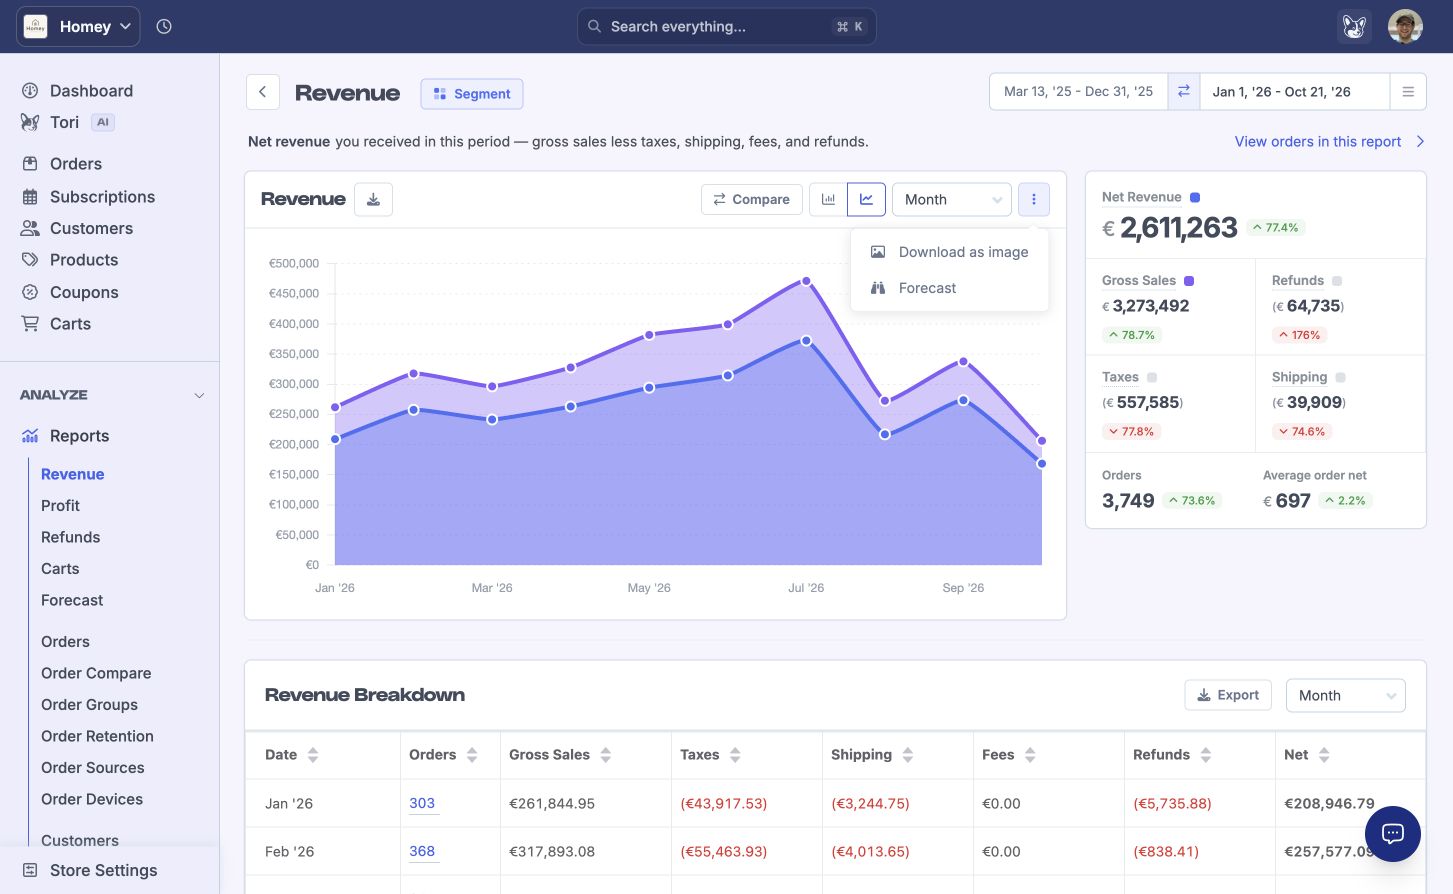
On a chart that supports forecasting, choose your historical date range and grouping, then open More chart actions (the three-dot button) and select Forecast. Metorik creates a forecast based on the data currently shown in the chart:
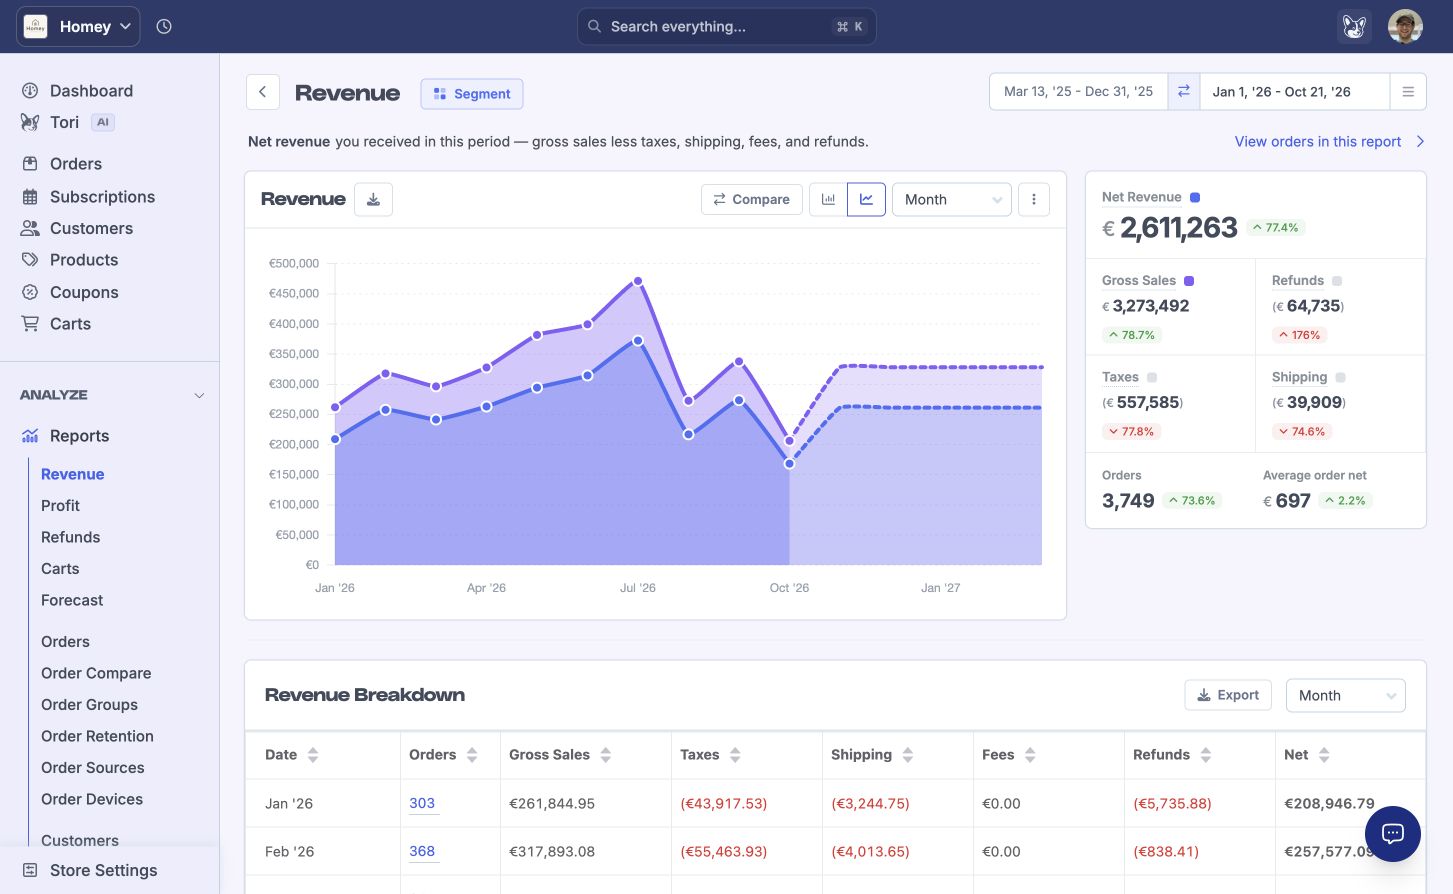
For example, the Revenue report below shows historical sales followed by dashed forecast lines:
Some considerations when forecasting:
Select a period with 10 to 1000 data points. If your chart has more than 1000 data points, choose a shorter date range or group the data into larger periods, such as weeks or months.
A flat or straight-line forecast can be the best fit for your data, even when seasonal models were considered. Changing the date range or grouping can change which models perform best.
Forecasts extend up to 300 future data points.
Stock Level Forecasts
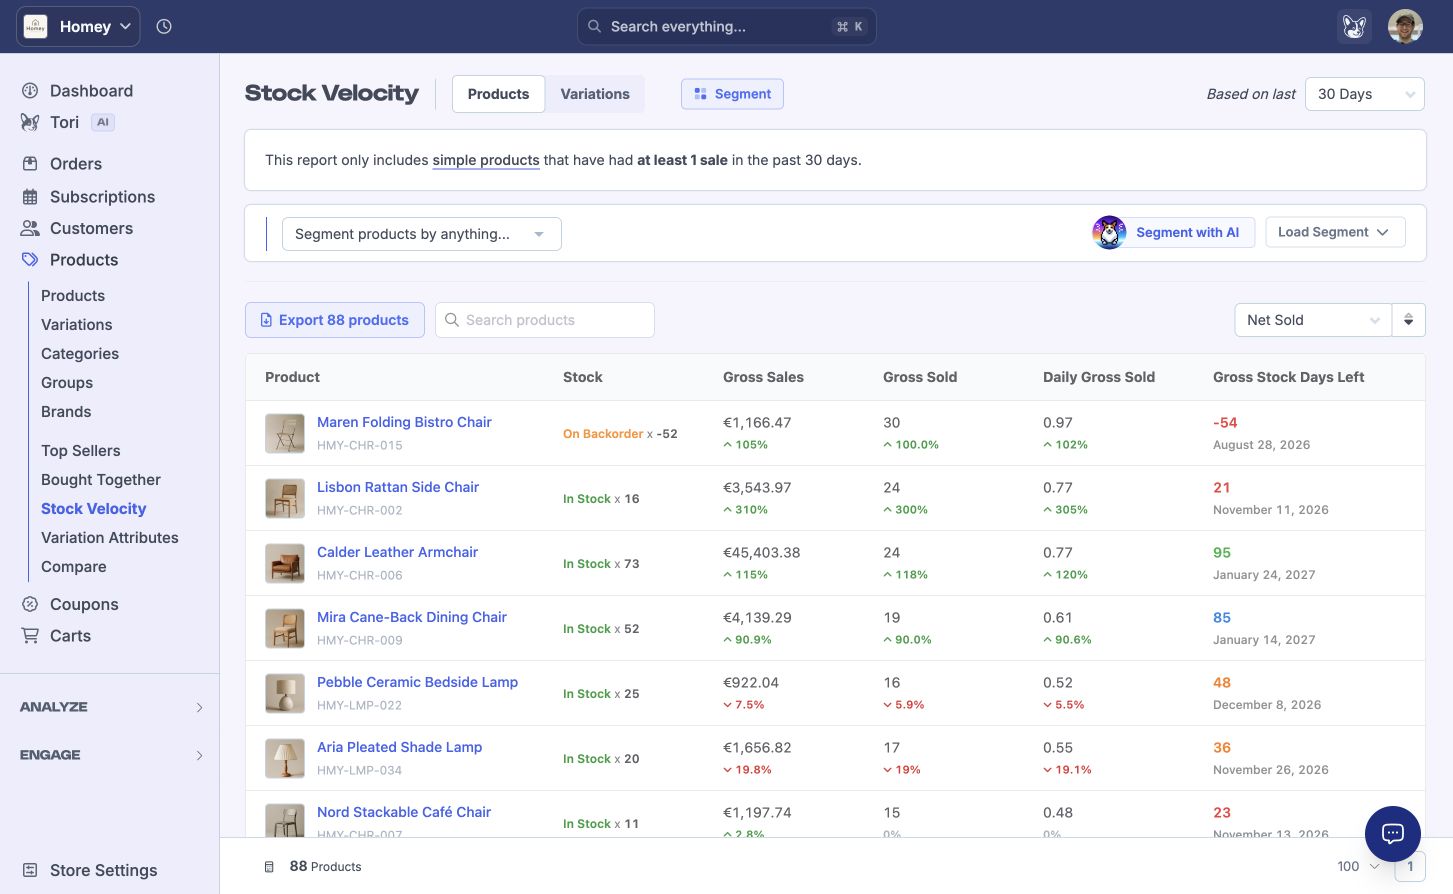
The product/variation velocity reports allow you to see how many days of stock you have available in your inventory. These estimates use your daily gross sold per product and the current stock on hand to calculate the estimated days of stock left.
With this information, you can make key decisions around when to order additional stock, which products are not performing, and which are exceeding expectations.
Open Products → Stock Velocity and use the Products or Variations tab. The Based on last dropdown in the top right lets you choose how many days of sales to use for the calculations.
Use the sort dropdown above the product list to choose Days of Stock, Daily Items Sold, or another metric. The table shows each product’s daily gross sold, current stock, and estimated days left: